Getting started
Overview
The Forecast dashboard is your command center for estimating campaign performance. Powered by machine learning, it projects your key metrics (like ROAS and Retention Rate) into the future, allowing you to make proactive budget and bidding decisions before your user cohorts fully mature.
Understanding Cohorts and the Date Picker
The foundation of the Forecast dashboard is cohort analysis.
- The Date Picker: Located at the top right of the page, this allows you to select a specific time window (e.g., "Last 14 days").
- How Cohorts Work: The date range you select strictly dictates the install dates. The dashboard groups all users who installed your app during this exact window into a "cohort." All actual performance metrics and future machine-learning forecasts displayed on the page are tied exclusively to the behavior of this specific group of users.
Navigating the Dashboard
- Filters: You can narrow down your cohort data using the filter bar at the top of the page to select specific dimensions (such as Campaign Name, Country, and Platform).
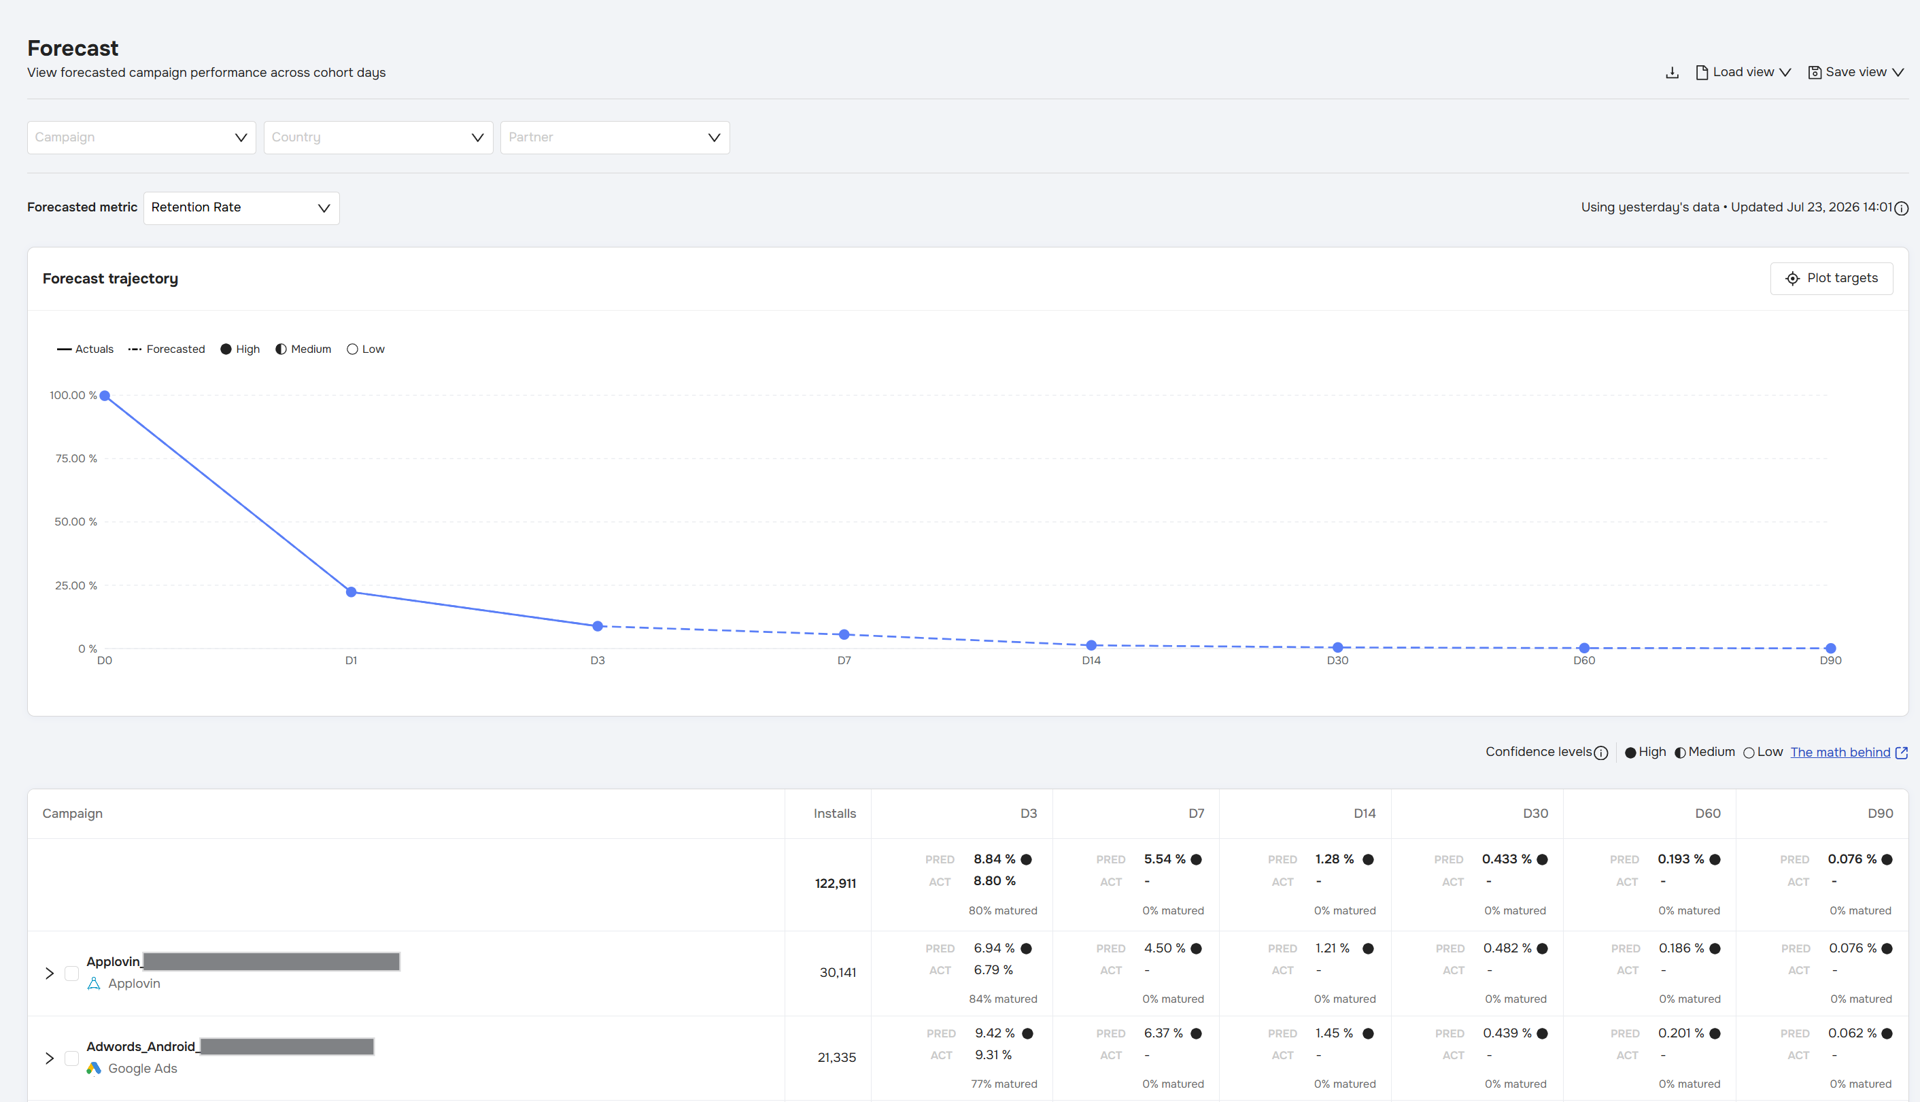
- The Forecast Trajectory Chart: This visualizes your aggregated performance over time. It plots your Actuals (solid line), your Forecasted trajectory (dotted line), and your configured Targets (diamond markers).
- The Data Table: Below the chart, you will find your campaigns broken down by cohort milestone days (e.g., D3, D7, D30).
- The Total / Avg Row: Pinned at the top of the table, this row provides a comprehensive summary of all the campaigns matching your current filters.
- The math behind the total: The calculation method dynamically adapts to the type of metric you are viewing.
- Absolute Metrics: For raw values (like Revenue or Payout), the system calculates a simple sum of all the campaign rows below.
- Dividing Metrics: For ratio-based metrics (like ROAS or ROI), the system calculates a weighted average based on the number of installs. Instead of simply averaging the percentages you see in the individual rows (which would artificially skew the data), this weighted approach ensures your aggregated metrics remain mathematically perfect, regardless of how budgets or user volumes are distributed across campaigns.
- The math behind the total: The calculation method dynamically adapts to the type of metric you are viewing.
Customizing and Exporting Your Workspace
To streamline your daily workflow, the Forecast dashboard includes tools to save your preferred setups and export data for external use. These options are located in the top right corner of the page.
- Saving and Loading Views: If you frequently analyze specific combinations of filters (such as a specific region, partner, and metric), you do not need to reconfigure them every time.
- Click Save view to store your currently applied filters and settings as a preset.
- Use Load view to quickly access and apply any of your previously saved configurations.
- Exporting Data: If you need to manipulate the data in Excel, Google Sheets, or share it with external stakeholders, click the Download icon (the downward-facing arrow next to "Load view"). This will instantly export your currently filtered data table as a
.csvfile.
Understanding Data Freshness
It is crucial to know exactly what timeframe of data the machine learning model is using to generate your forecasts.
You can always verify the recency of your data by checking the status indicator located on the right side of the screen, directly above the Forecast Trajectory chart (e.g., "Using yesterday's data • Updated Jul 23, 2026 14:01").
- Historical Data Window: The machine learning forecasts are generated using your historical campaign data up through the end of yesterday.
- Last Updated Timestamp: The timestamp shows the exact date and time that the forecast model last refreshed the forecasts on your dashboard, ensuring you always know how current your insights are.
How Geographic Data is Grouped
To keep your dashboard fast and easy to read, the system dynamically groups geographic data:
- When you expand a campaign to view its country breakdown, the system automatically displays the Top 10 countries by install volume for your selected date range.
- All remaining traffic is combined into a single "Others" row at the bottom of the list. (Note: If a campaign has traffic from 10 or fewer countries, this row will not appear).