Analyze in-app purchases
View in-app purchase revenue
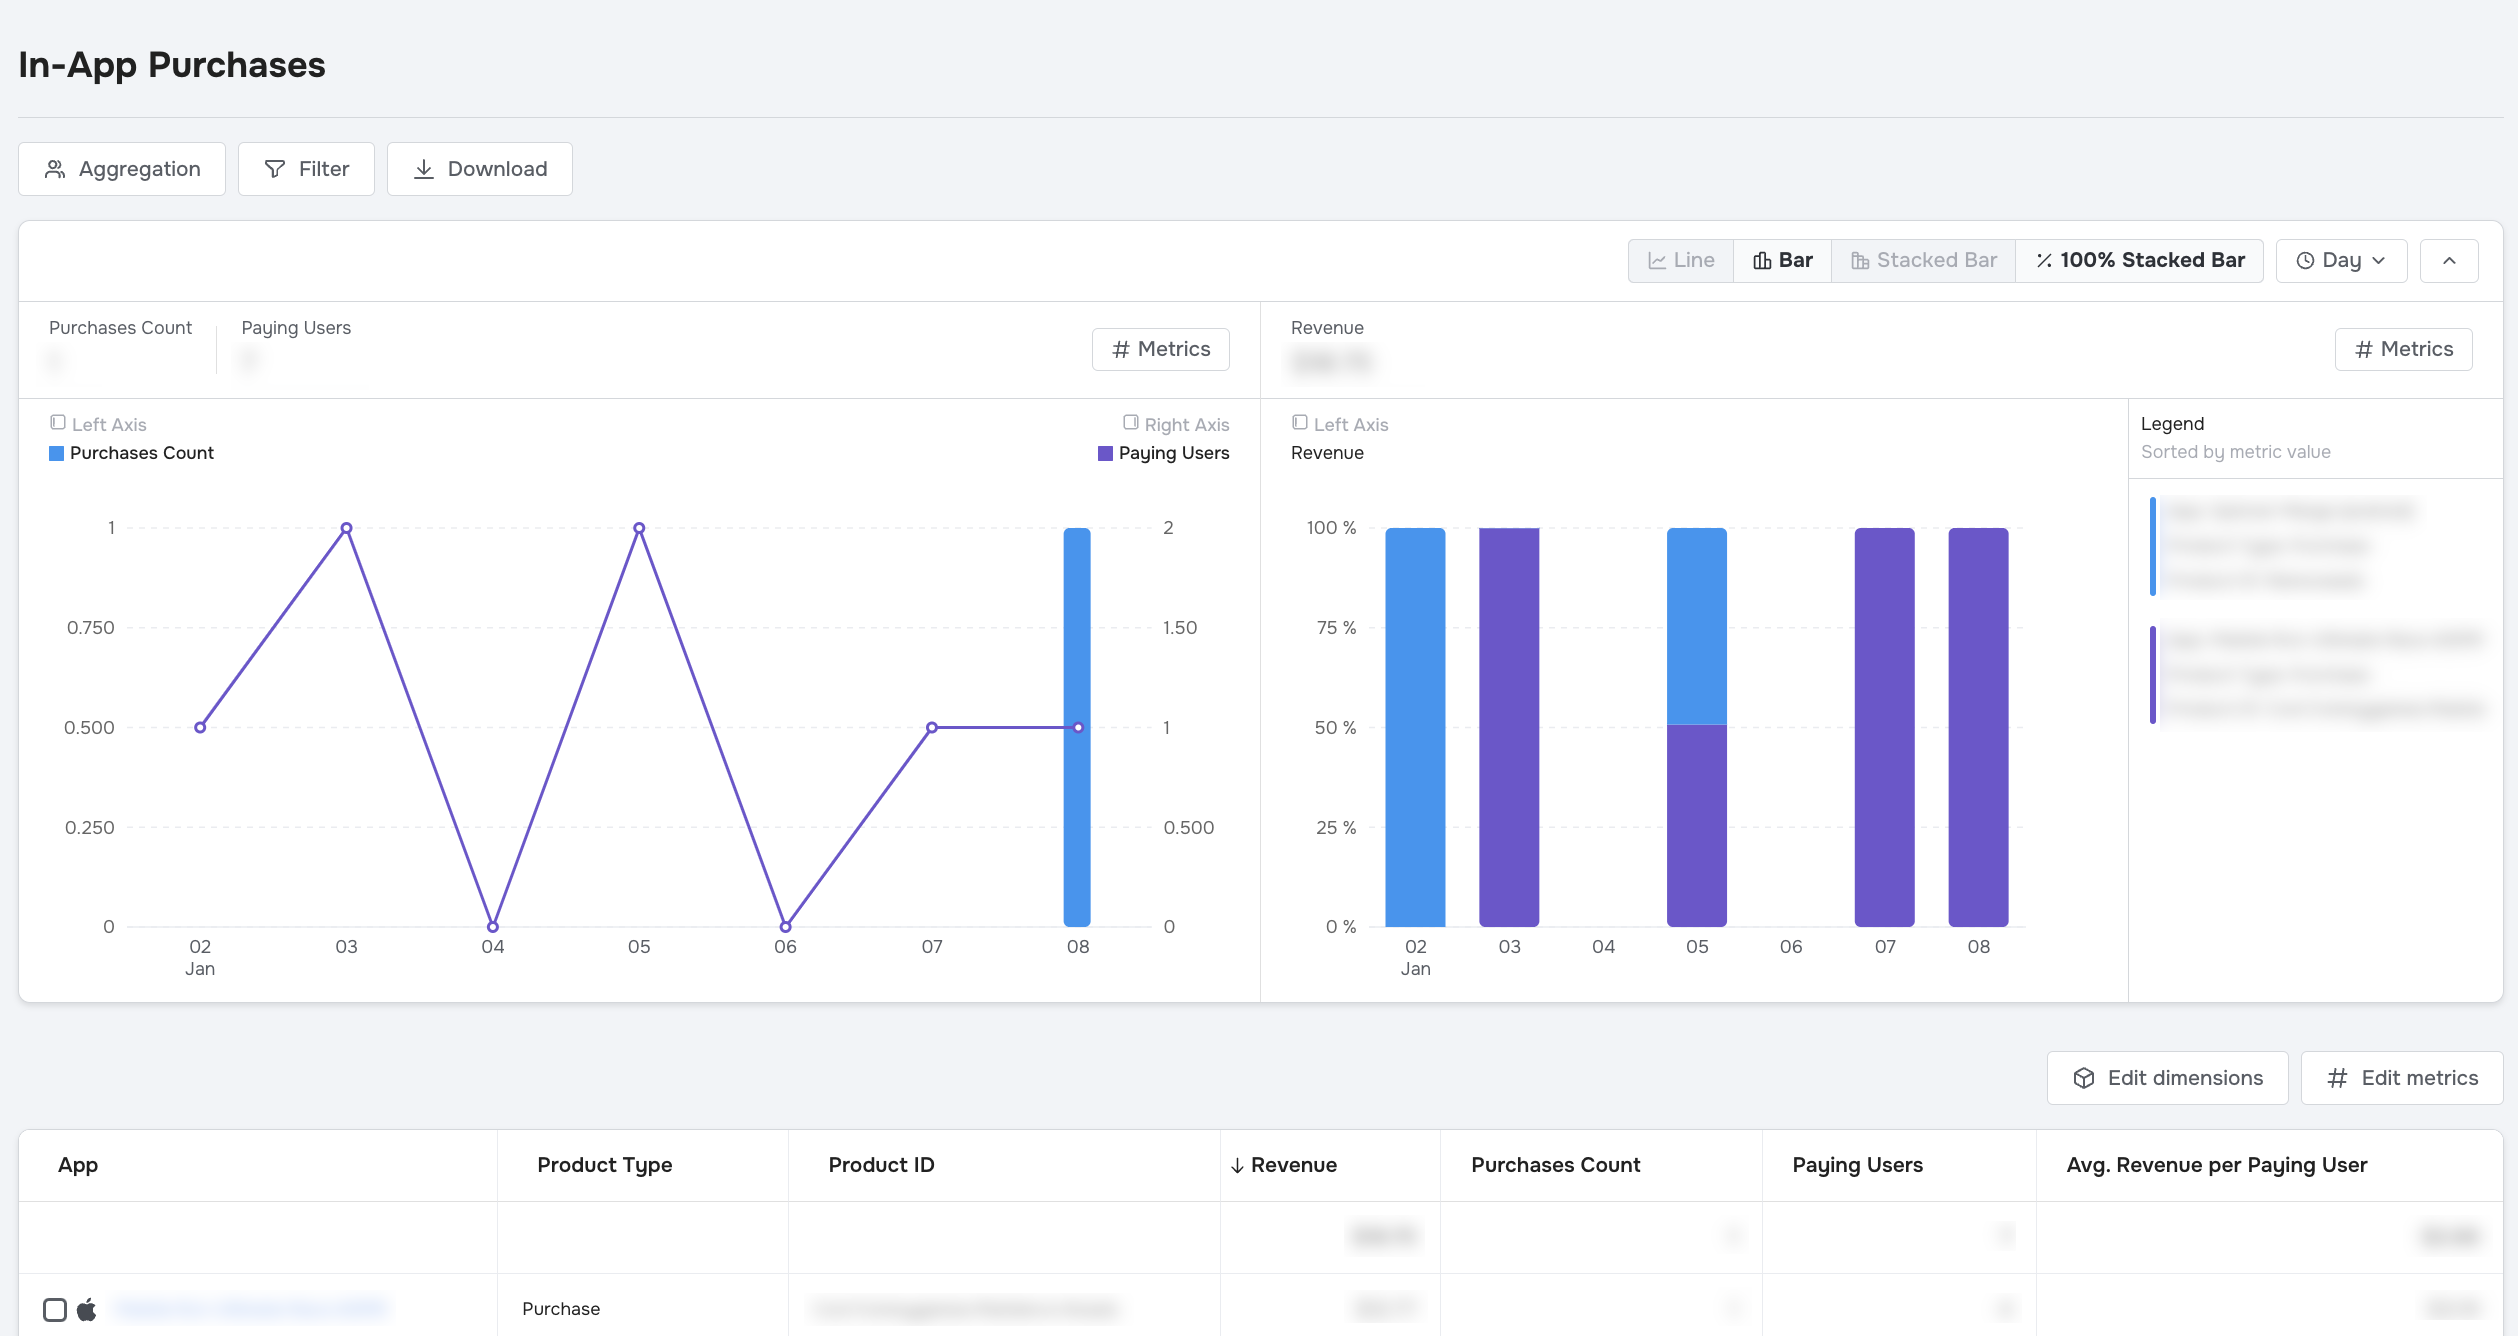
In the App Menu, click Monetization > In-App Purchases
Even though the In-App Purchases view is visually and functionally similar to the other data views, especially the Statistics view, the view's intent to zoom in on in-app purchase data distinguishes it from the others.
Now that you've navigated to the In-App Purchases view, you'll learn to edit metrics.
Edit metrics
In-App Purchases is for analyzing the revenue you receive from in-app product purchases and subscriptions. As such, the metrics available in this view are tailored for that purpose.
By default, the view offers four metrics:
- Revenue
- Purchases Count
- Paying Users
- Average Revenue per Paying User
You can remove or reorder these just like in other data views.
You can also add custom metrics:
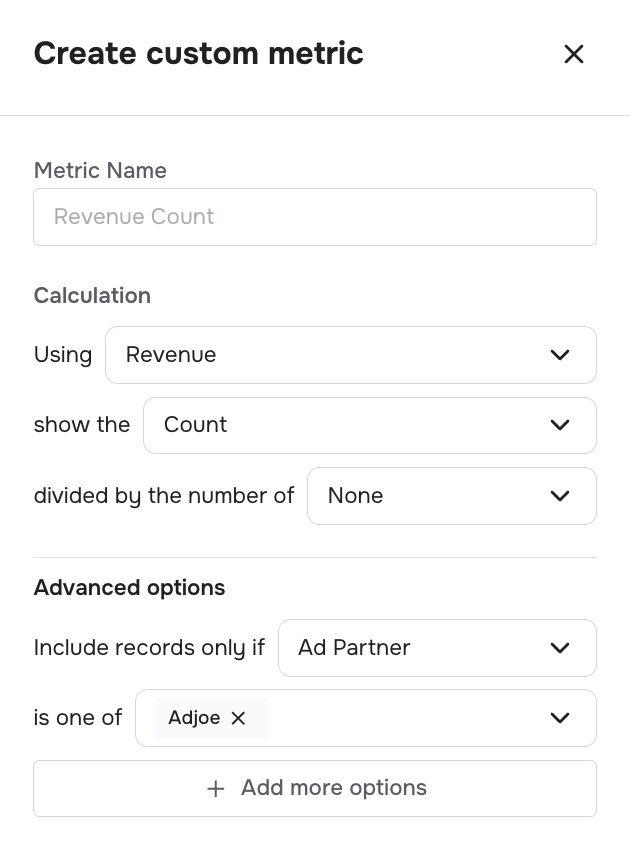
Custom revenue metrics in the In-App Purchases view are more configurable than the same revenue metrics in non-monetization data views like Statistics.