Analyze user retention
One of the most common use cases for Cohort Analysis is analyzing user retention. In this case, you want to understand how often users come back to your app after they first install it.
In this guide, you'll learn how to:
- Configure the Cohort Analysis table to display user retention for specific apps.
- Visualize some important retention data.
Navigate to cohort analysis
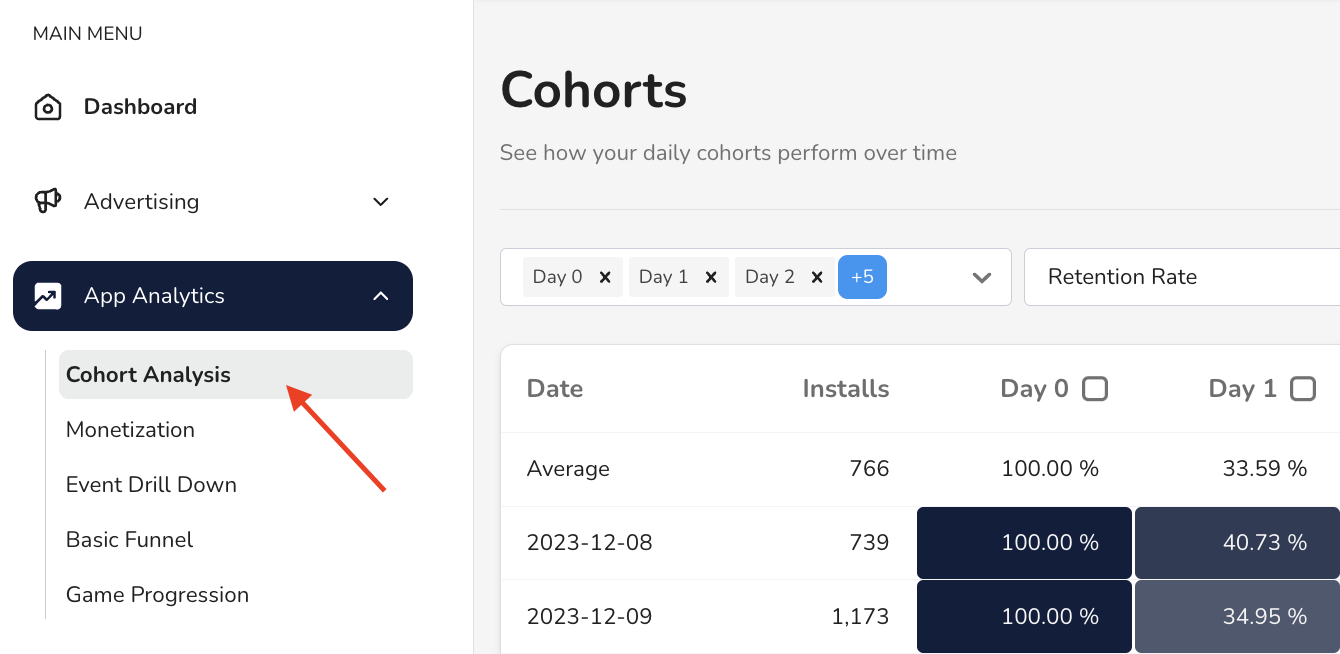
In the Main Menu, click App Analytics > Cohort Analysis:
Narrow your user segment
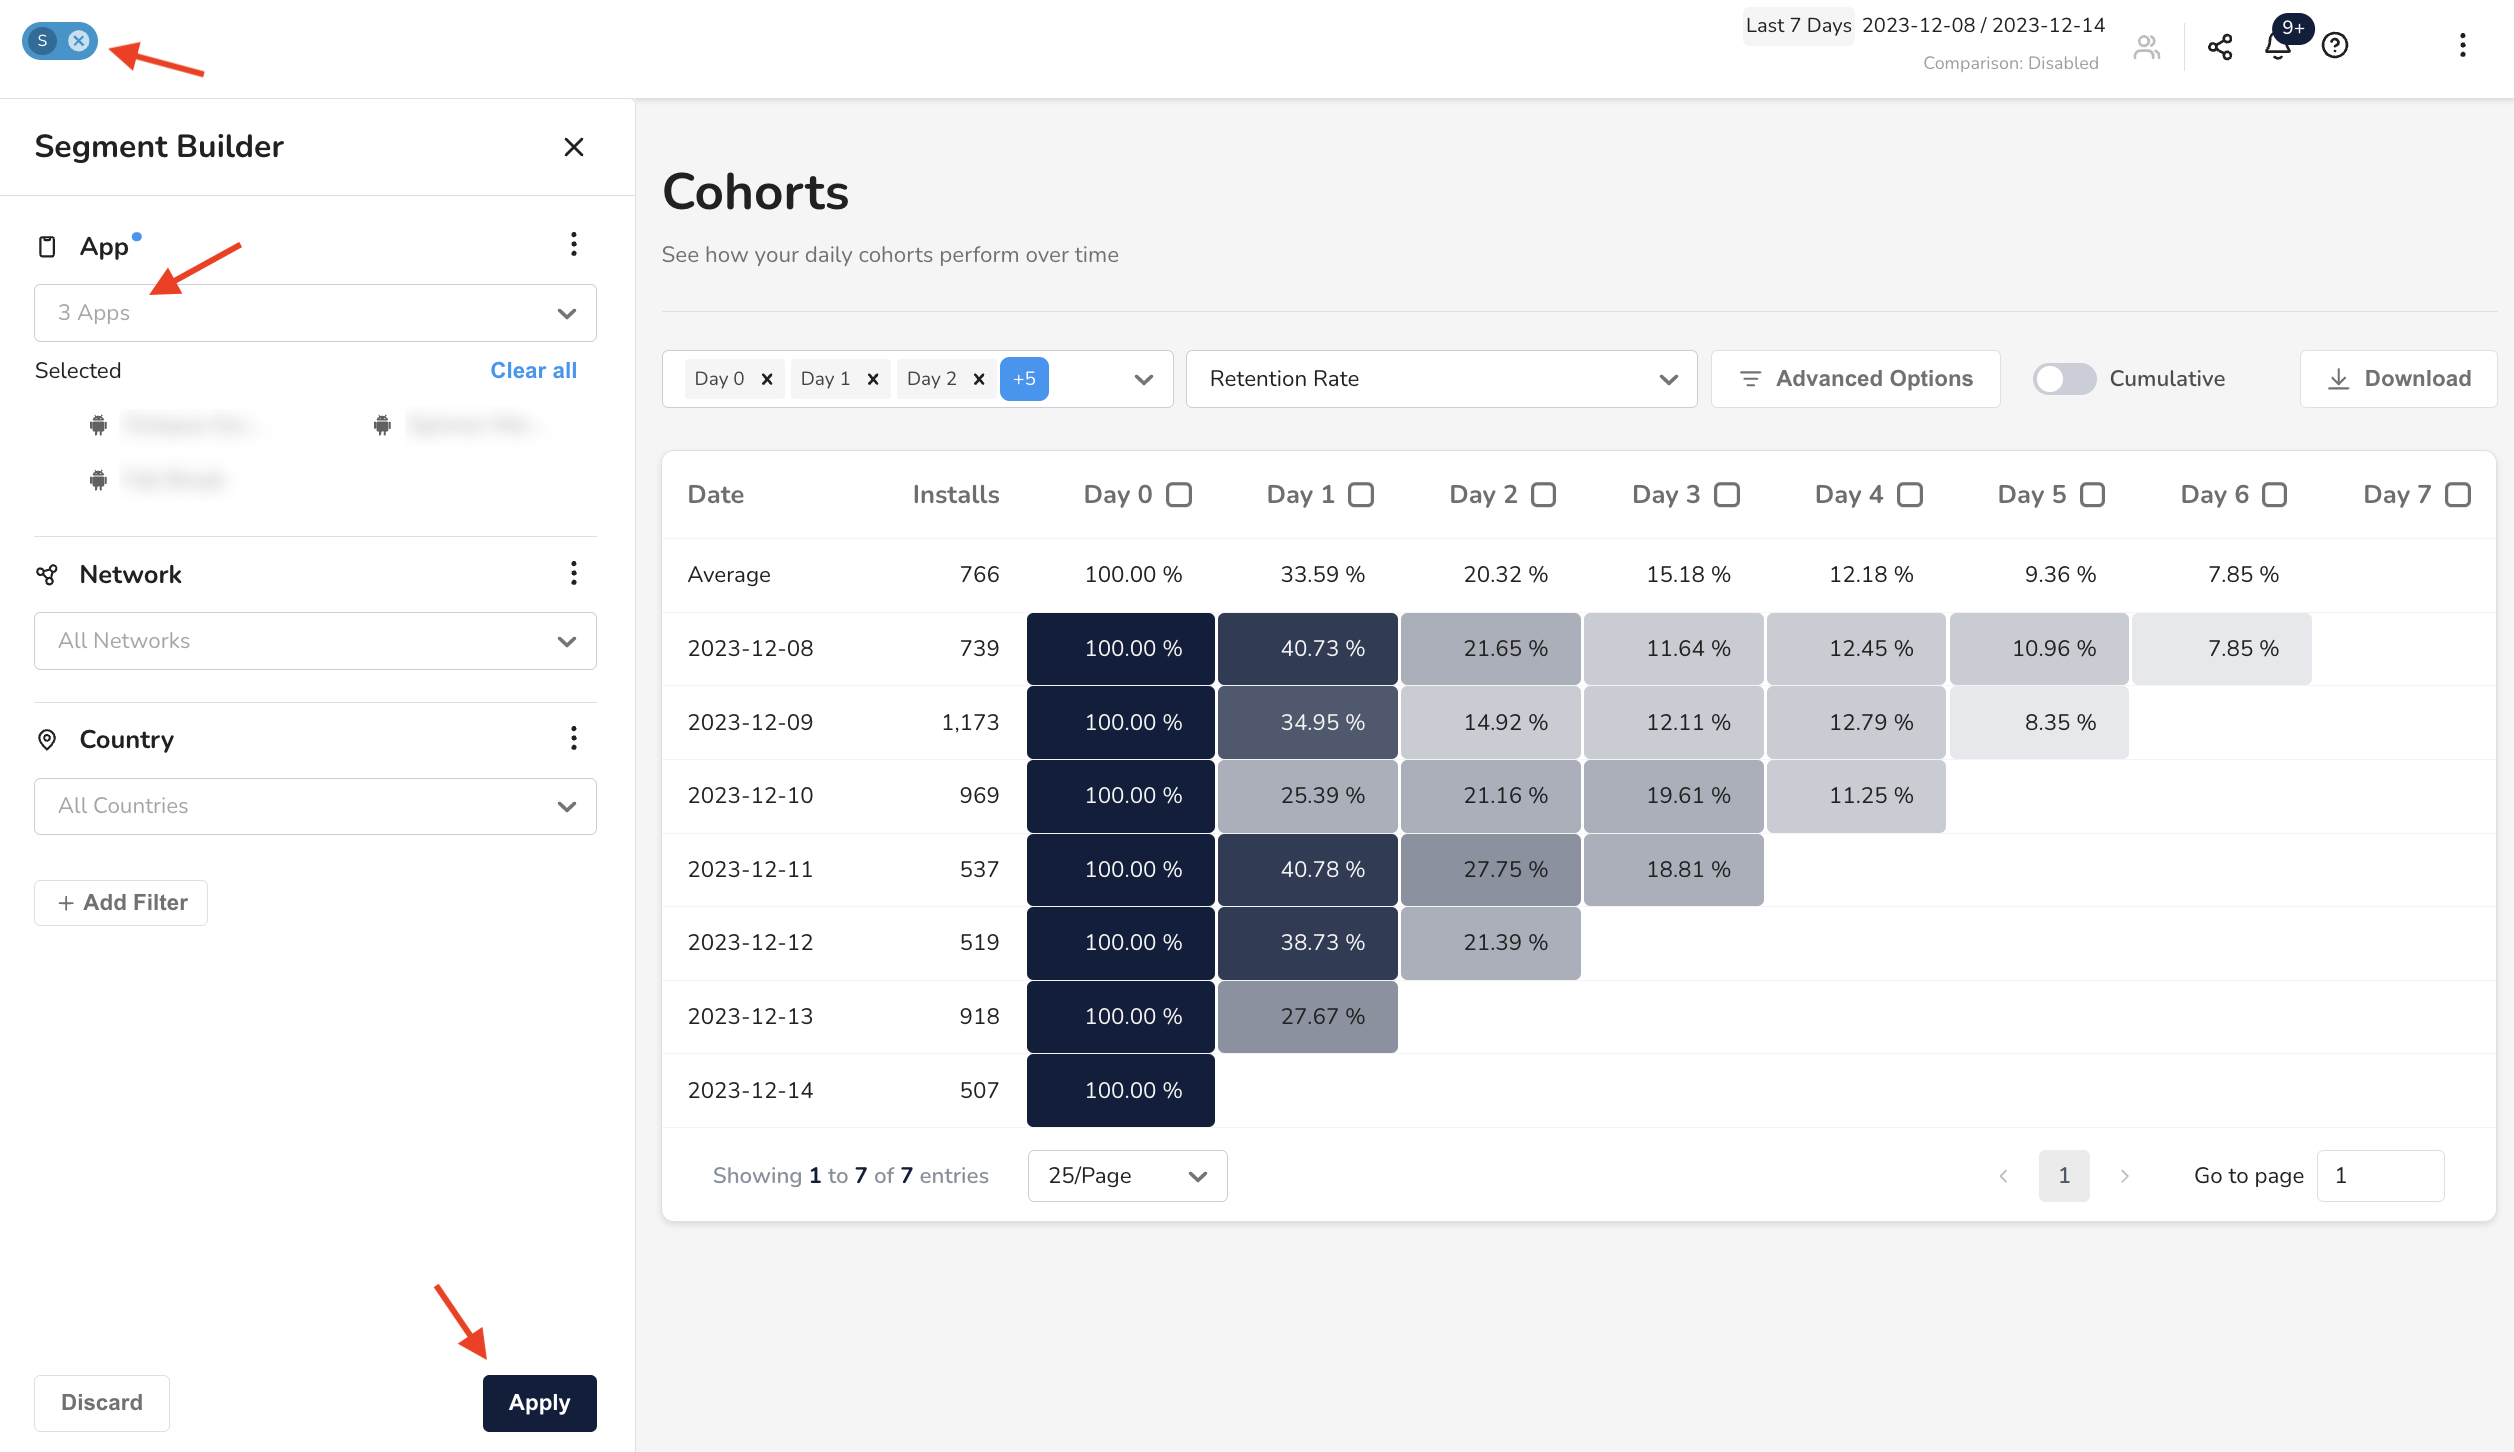
Before you configure your cohort and metrics, you need to narrow the user segment. In this guide, you'll narrow the segment by application so you can analyze the retention for a specific subset of apps:
- Click the default All Users segment.
- Choose the app or apps you want to analyze.
- Click Apply.
There are also other ways to segment your users. Read Manage your segments to learn more.
Now, your cohorts are limited to only the apps you selected.
Configure your metrics
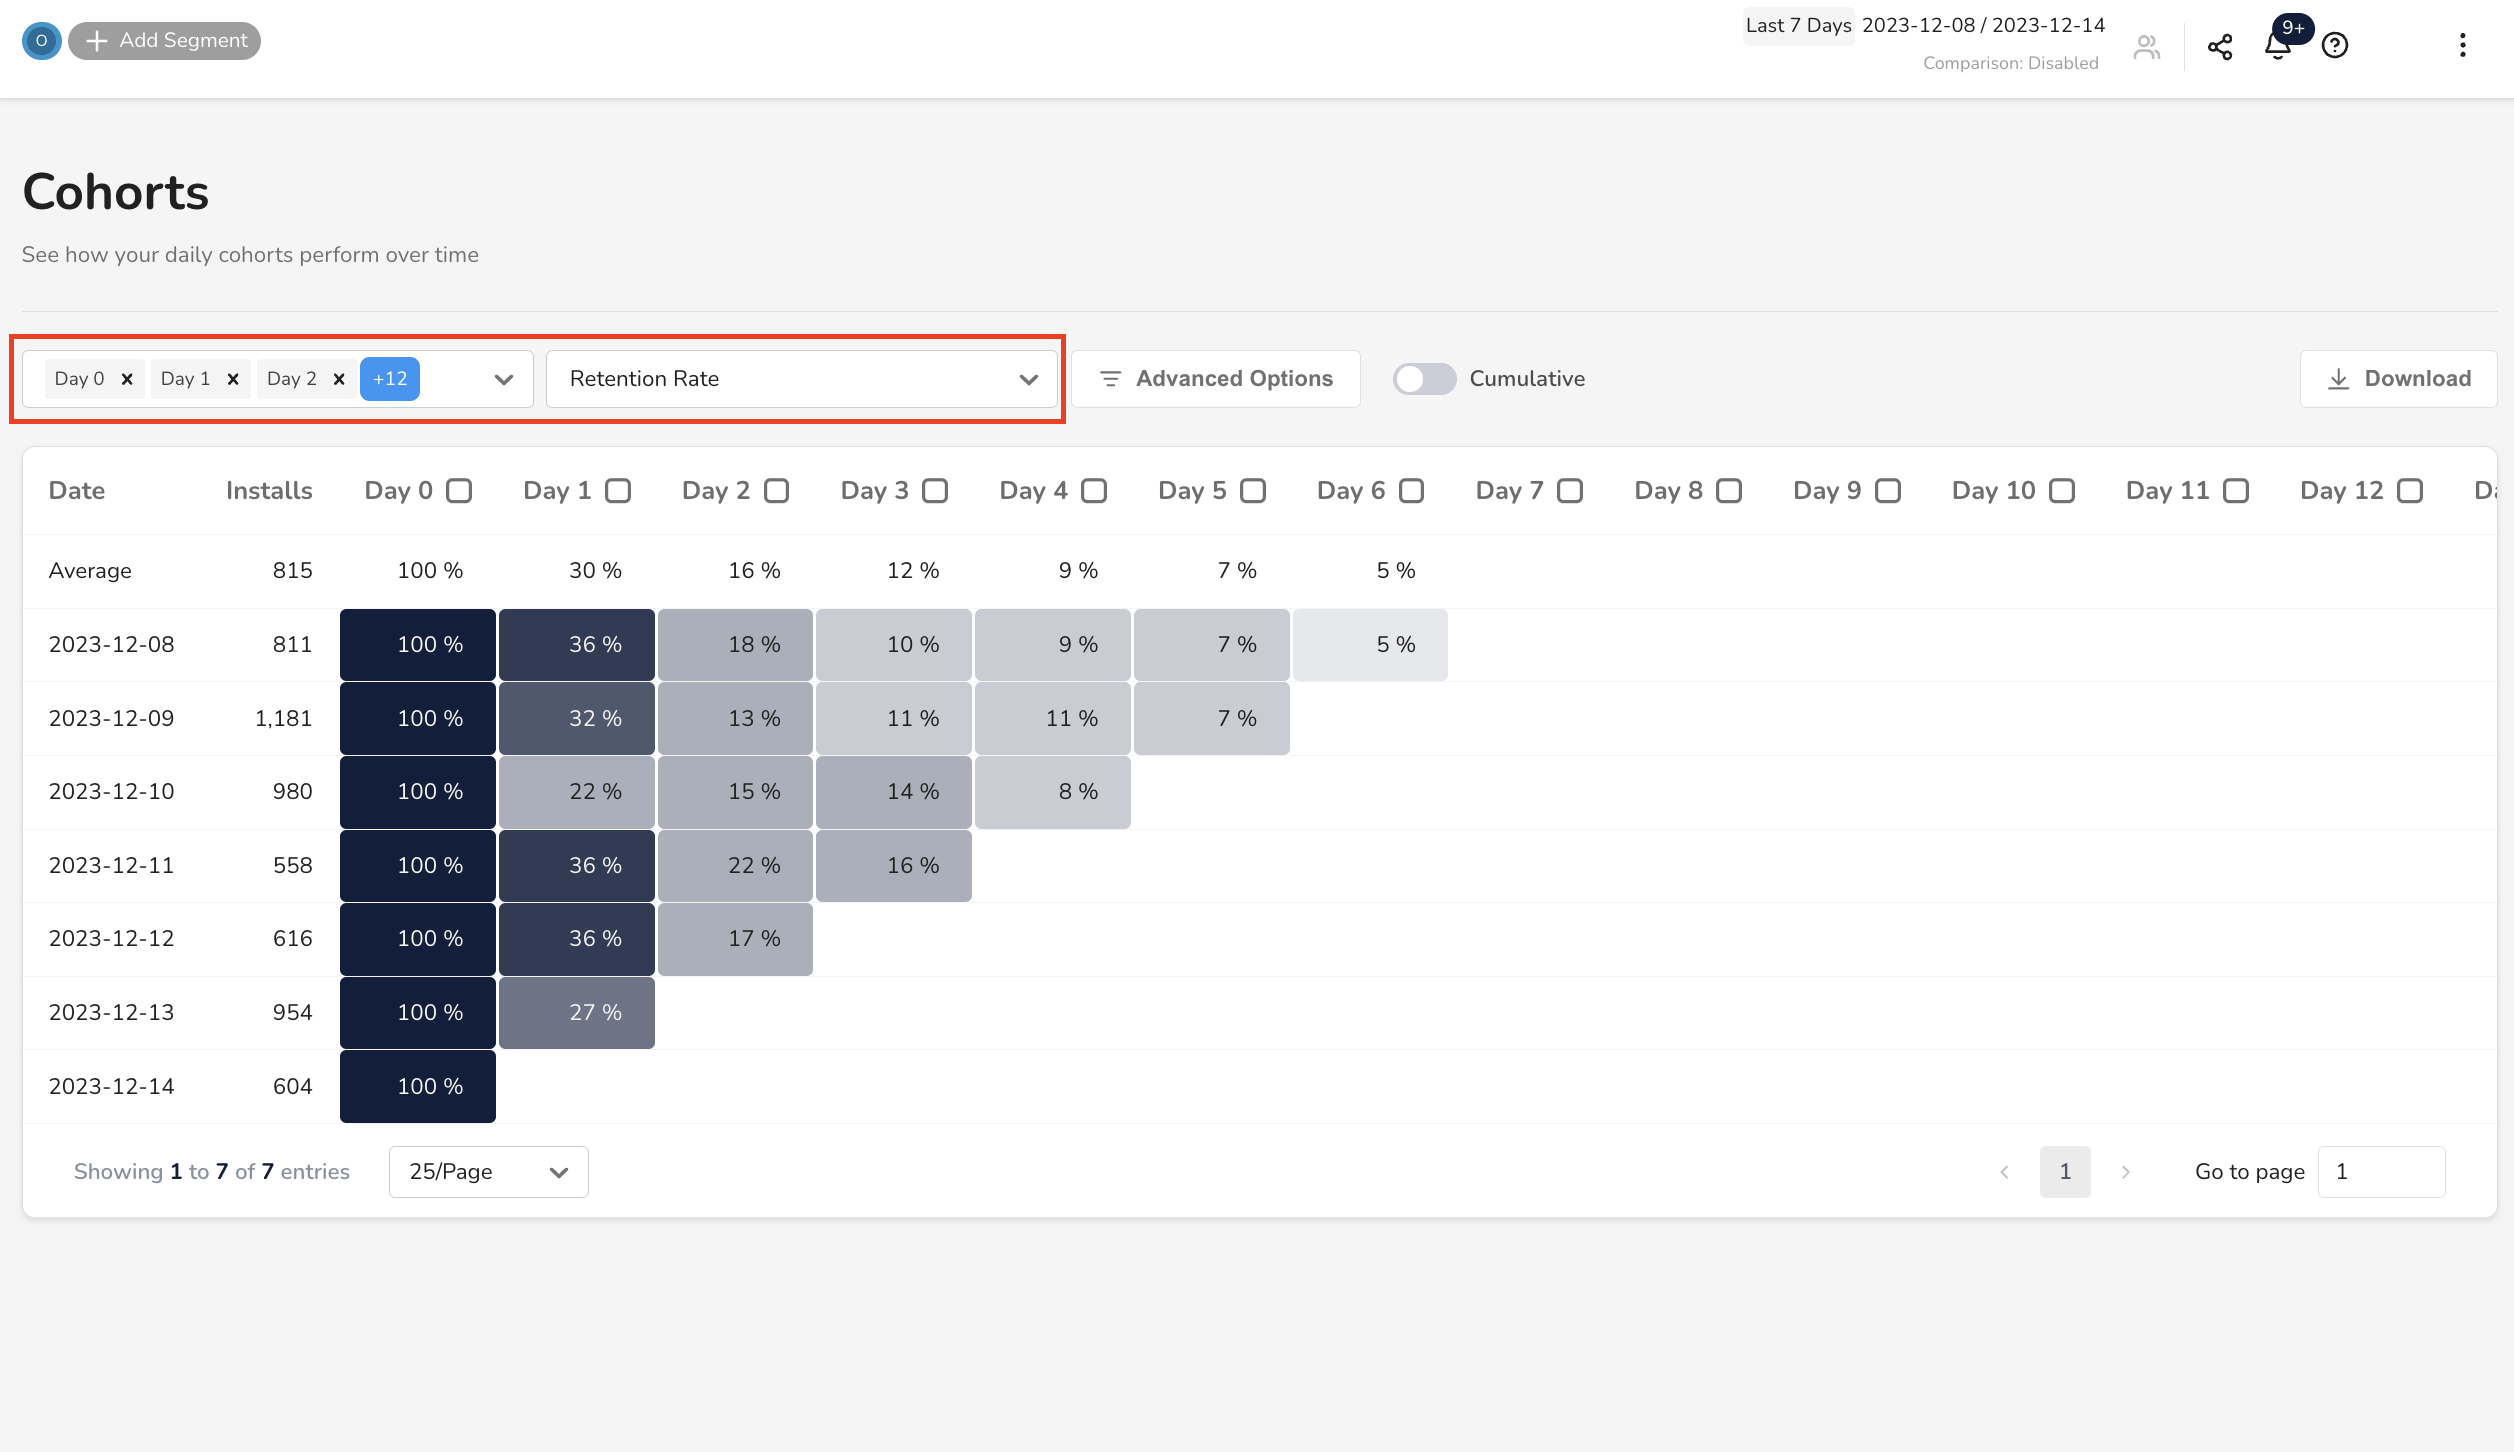
Next, you need to configure the metrics in the cohorts table. In this guide, you'll look at the retention metric for the first two weeks after users install your app.
- Select days 0-14 from the days since install dropdown.
- Click Confirm.
- Choose Retention Rate from the metric dropdown.
Change the time frame
This configuration isn't very helpful yet because your table only shows cohorts for the last seven days. In this case, you won't have enough data to see two-week retention. Now, you'll update your table to show the last month's worth of cohorts.
- Click the date picker.
- Select Last 30 Days.
- Click Apply.
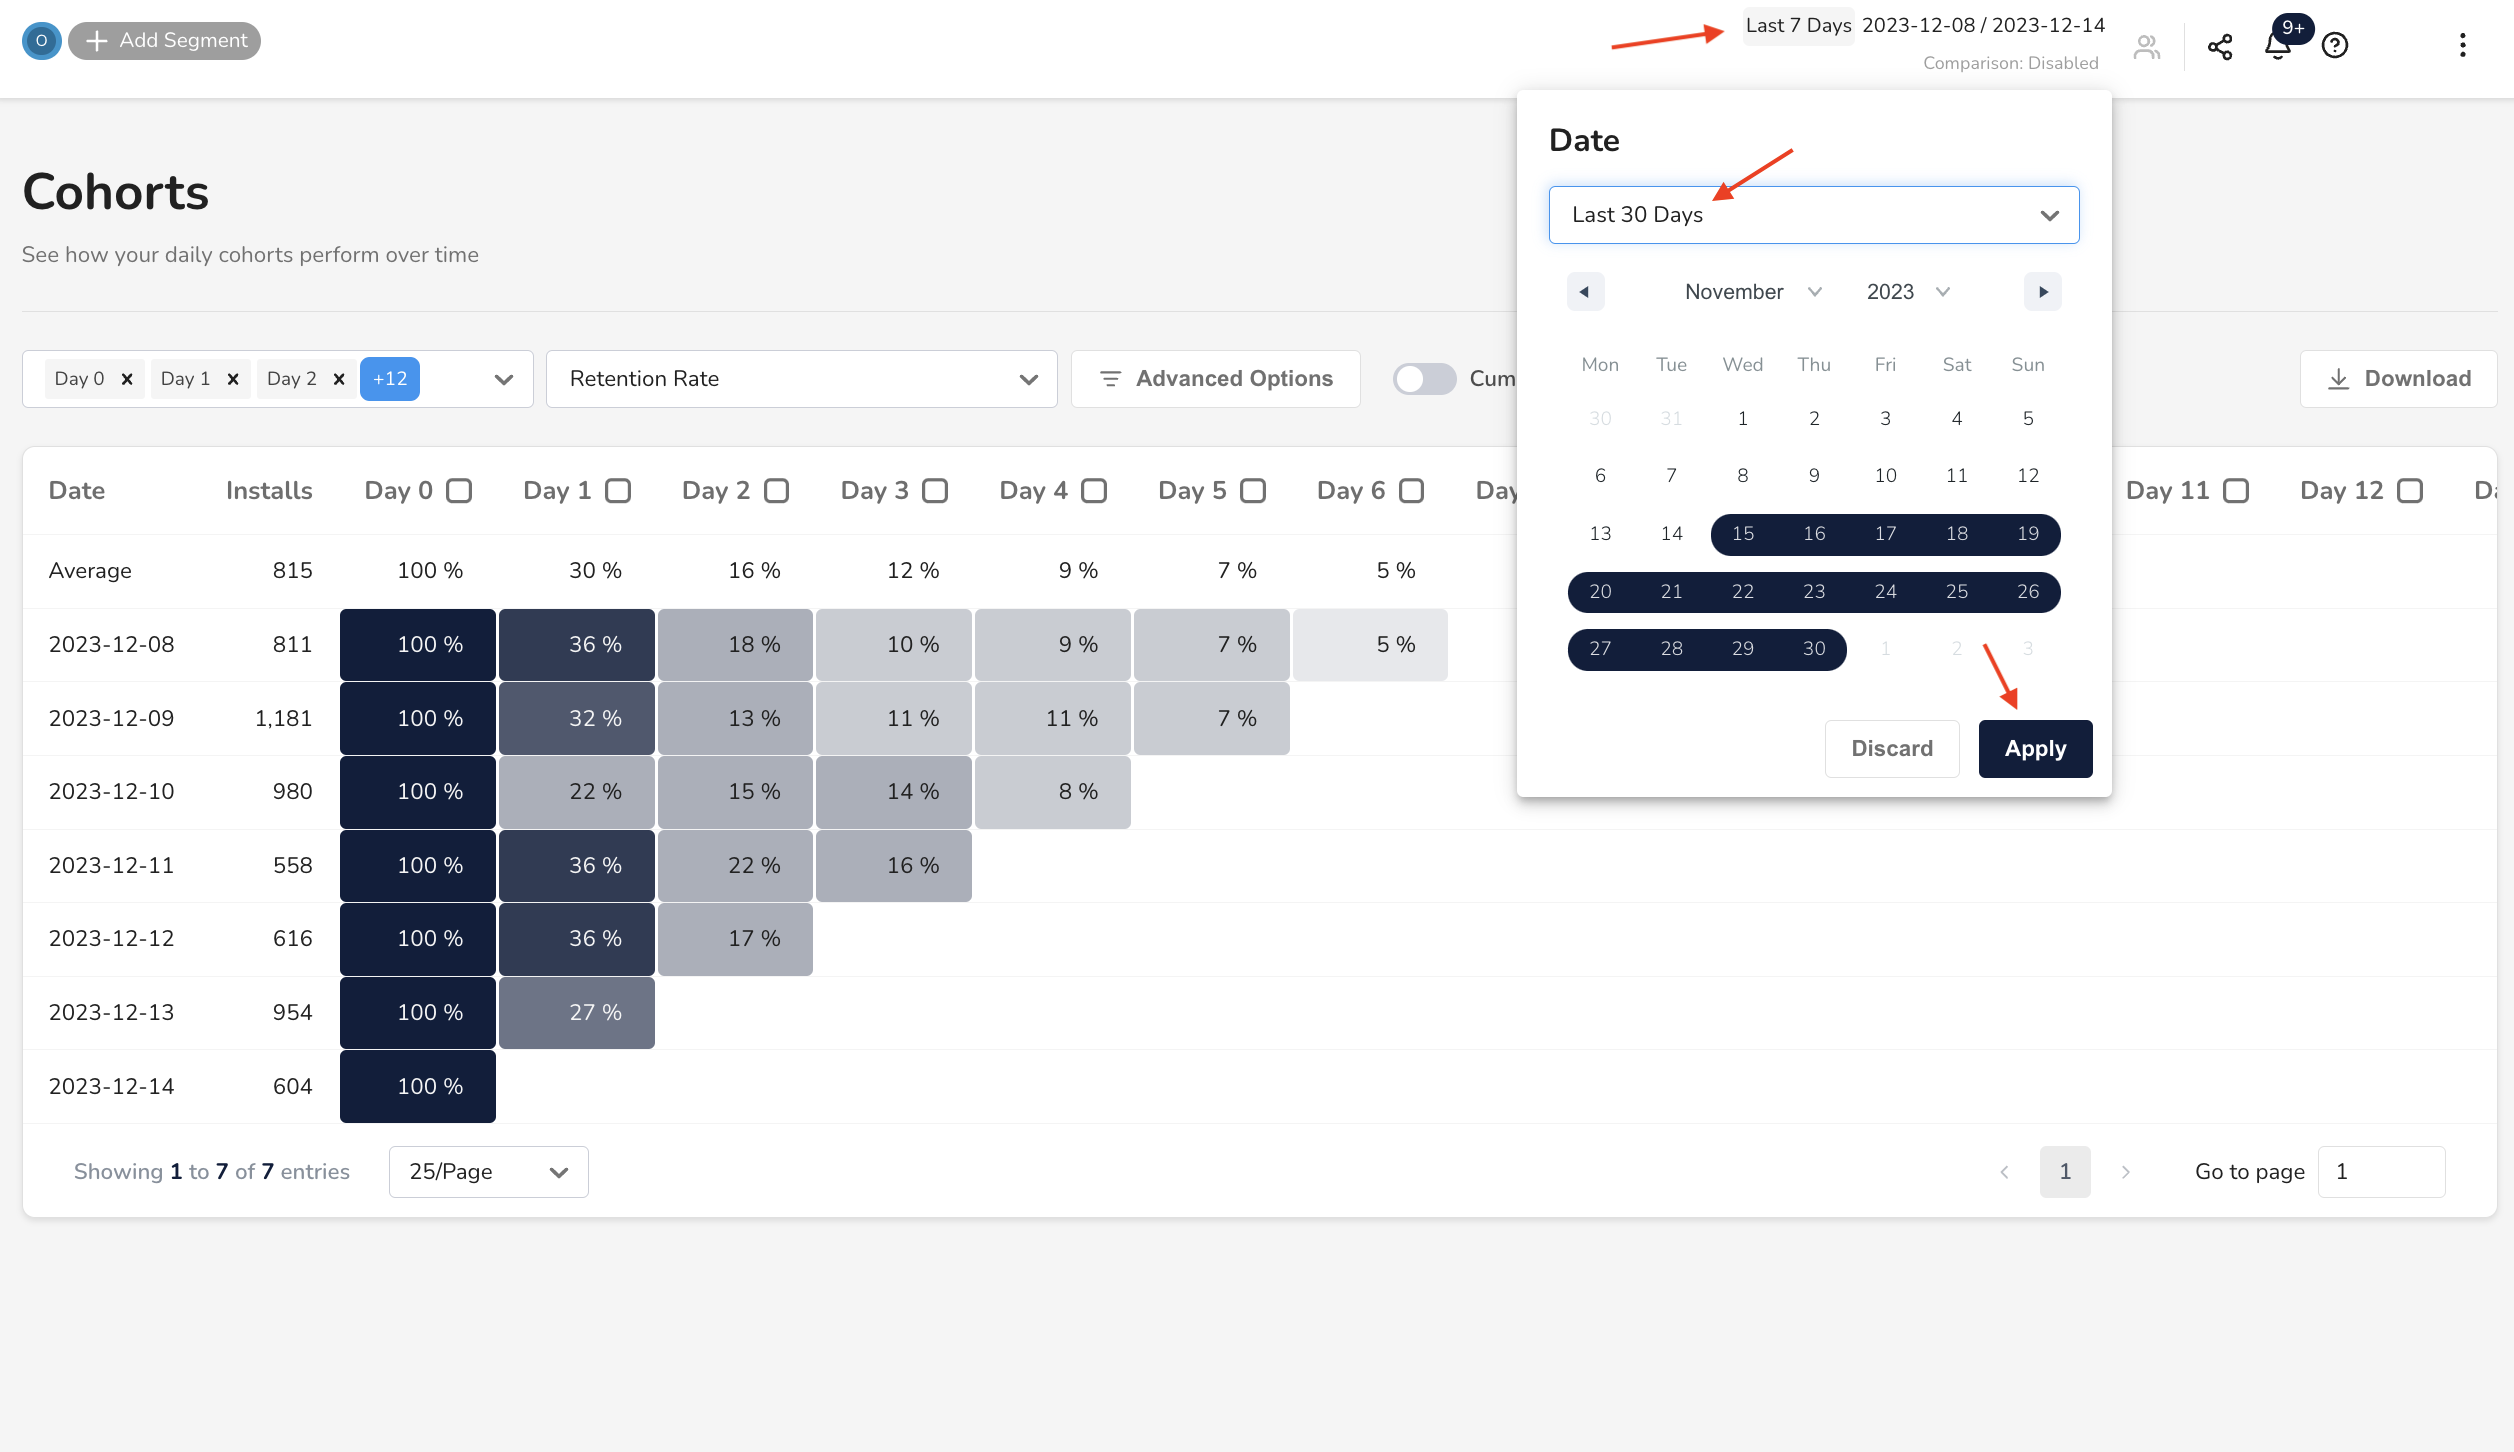
Now, you can see your two-week user retention, given a month's worth of cohorts.
Visualize retention
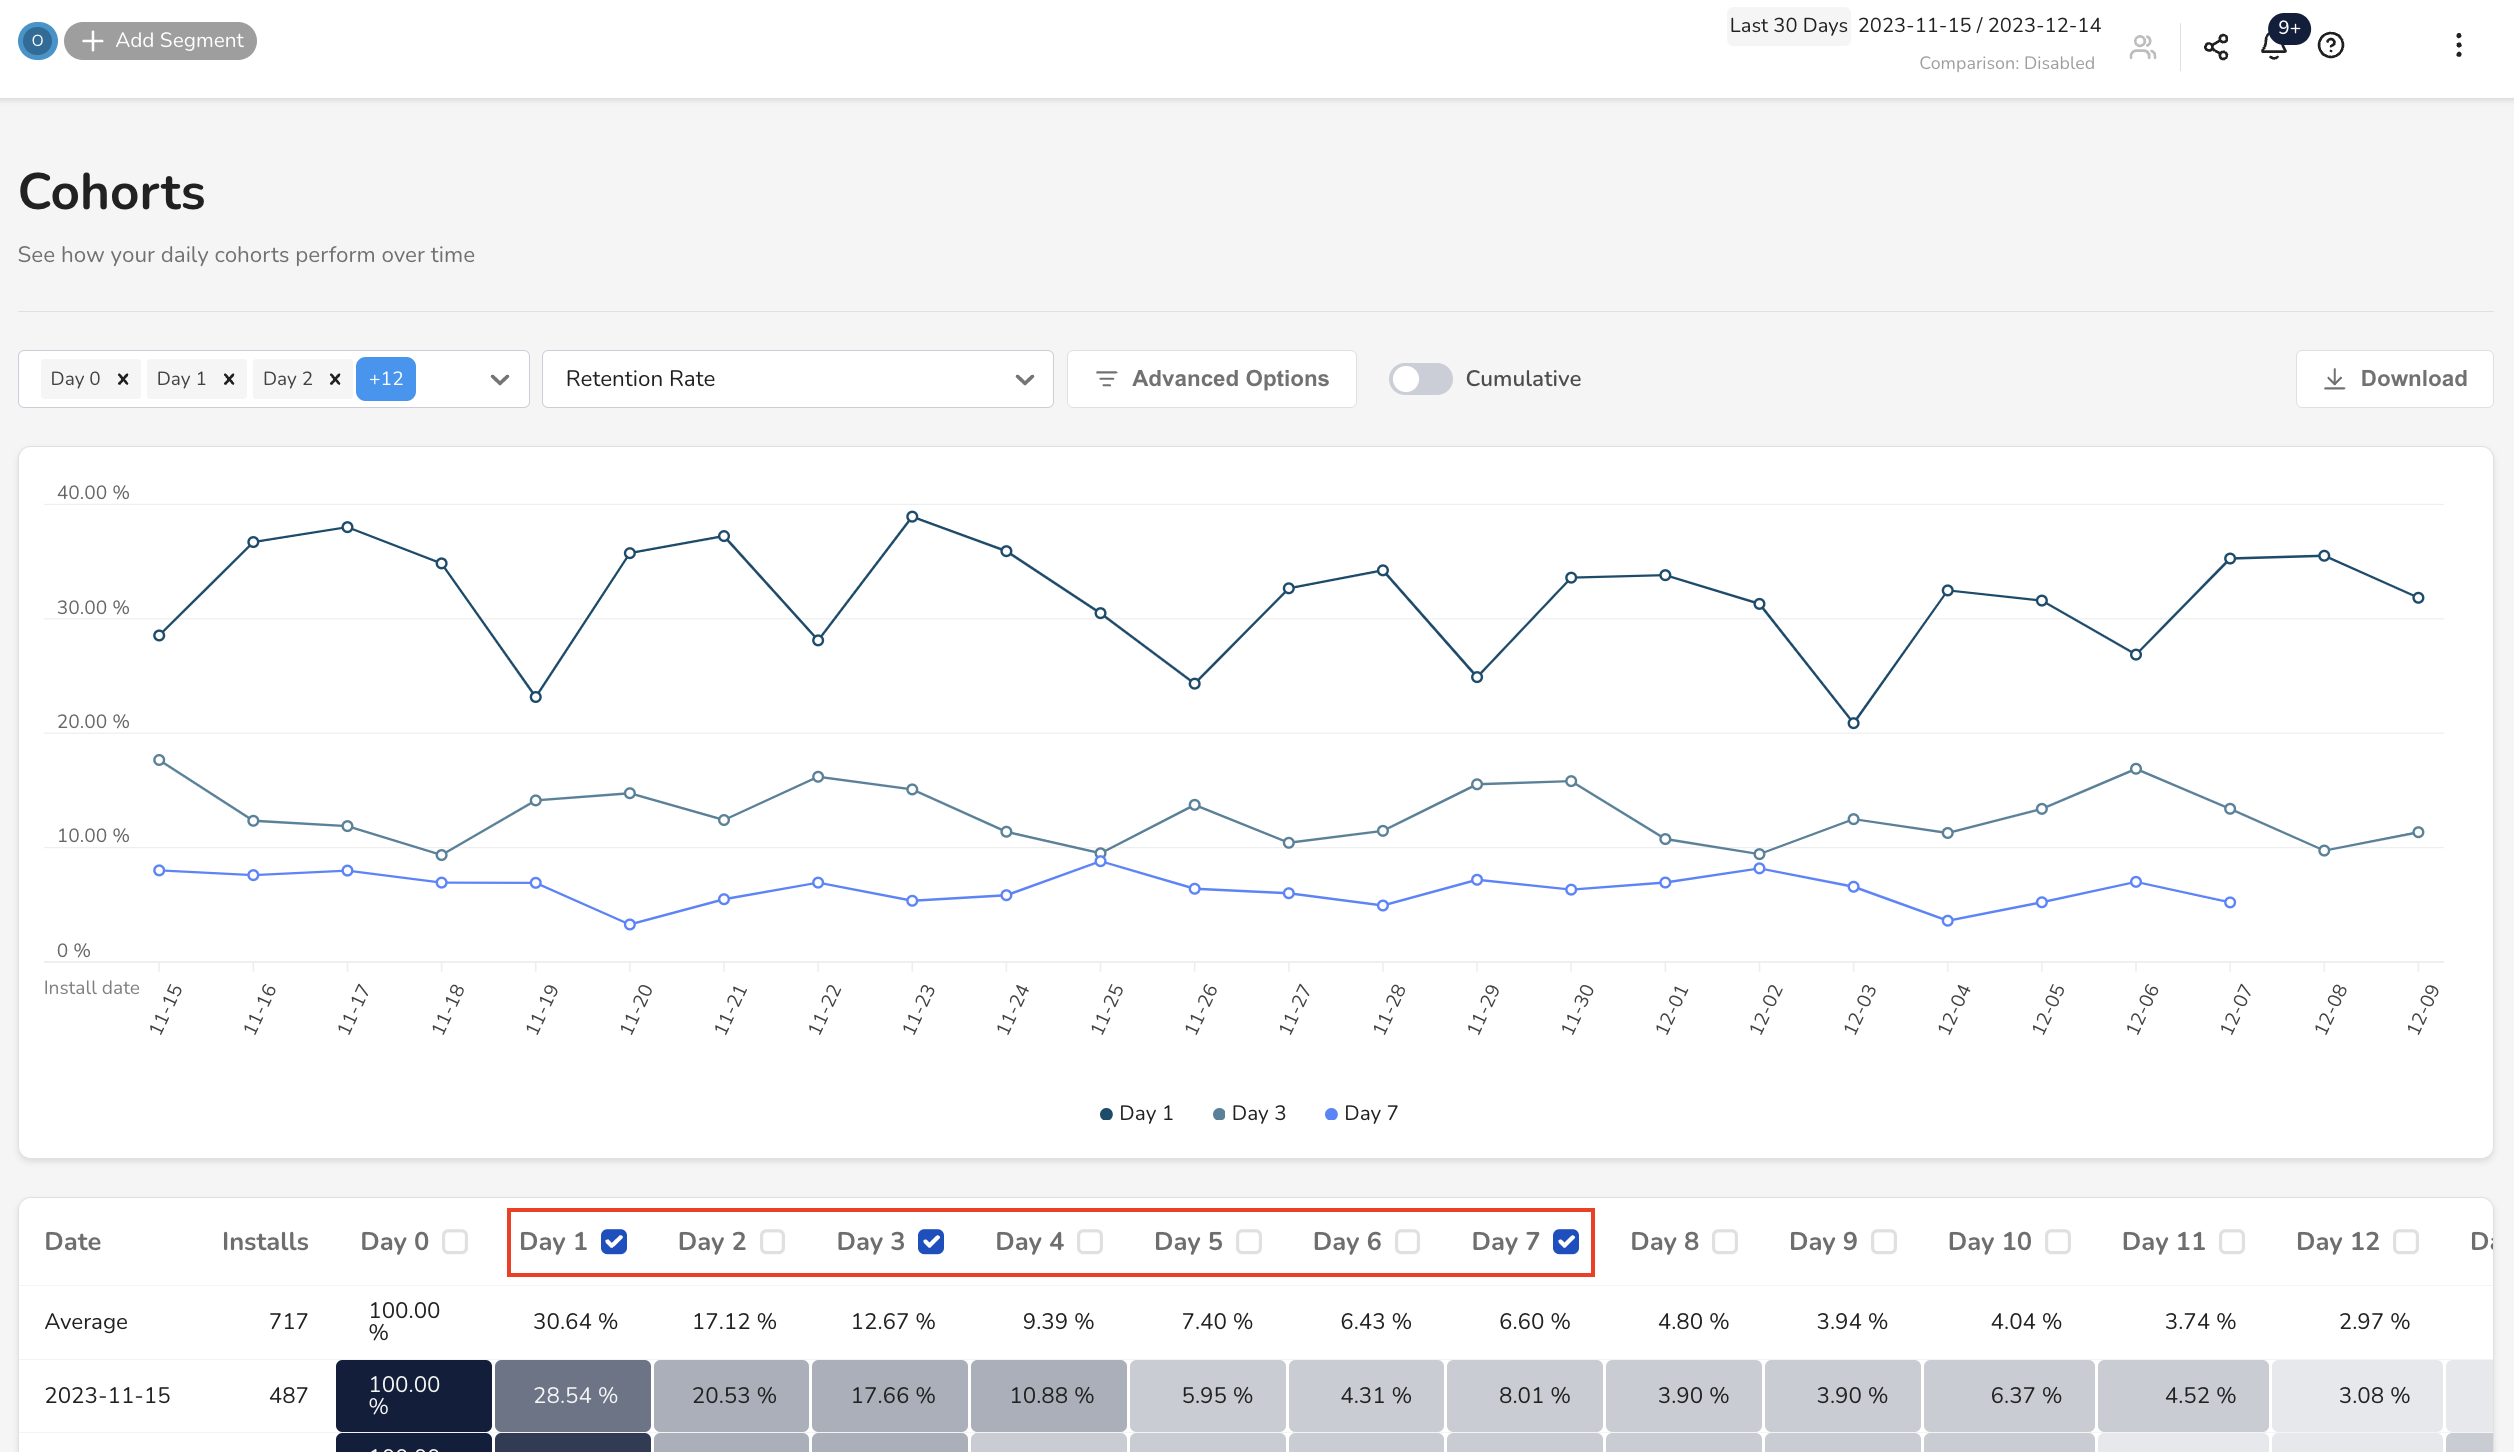
While you can see your data in the table, visualizing certain aspects of that same data in a chart can be helpful. To do so, check the box next to the days you want to visualize.
For example, if you want to visualize your day-1, day-3, and day-7 retention, check the boxes for those three days:
Conclusion
Great work! With this guide, you learned how to configure cohorts and present them in both table and chart formats.
To learn more about cohorts and Cohort Analysis, check out this documentation: