Configure charts
For the data view charts, you can:
- Choose the dimension values to include
- Choose the metrics to include
- Configure the presentation of the metrics
In this guide, you'll learn how to edit data view charts.
The justtrack platform doesn't persist chart configurations outside the scope of a session. So, if you open a new tab, browser, or window, you will see the default chart configurations.
Before you begin
This guide is relevant for the following data views:
Though, the exact options available to you differ between these views.
Include specific data
By default, the charts include data from every combination of dimension values in the table. For example, assume your table has two dimension columns, Network and App. The charts will show data for every Network and App pair, by default. However, if you want to limit the chart data to only specific pairs, you can do that.
This functionality is only available in the Statistics data view.
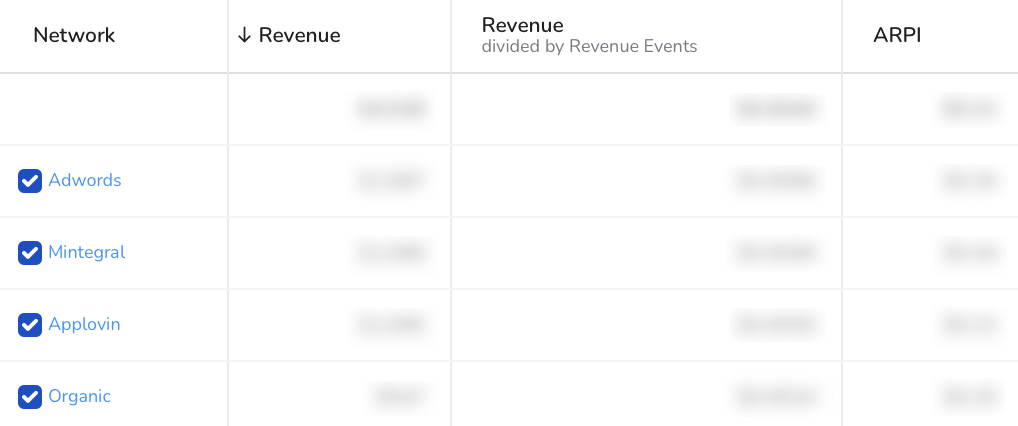
In the first column of the data view's table, select up to four rows to include in your charts:

The metric data presented in the chart will now be constrained to the dimension values in the rows you selected.
Edit chart metrics
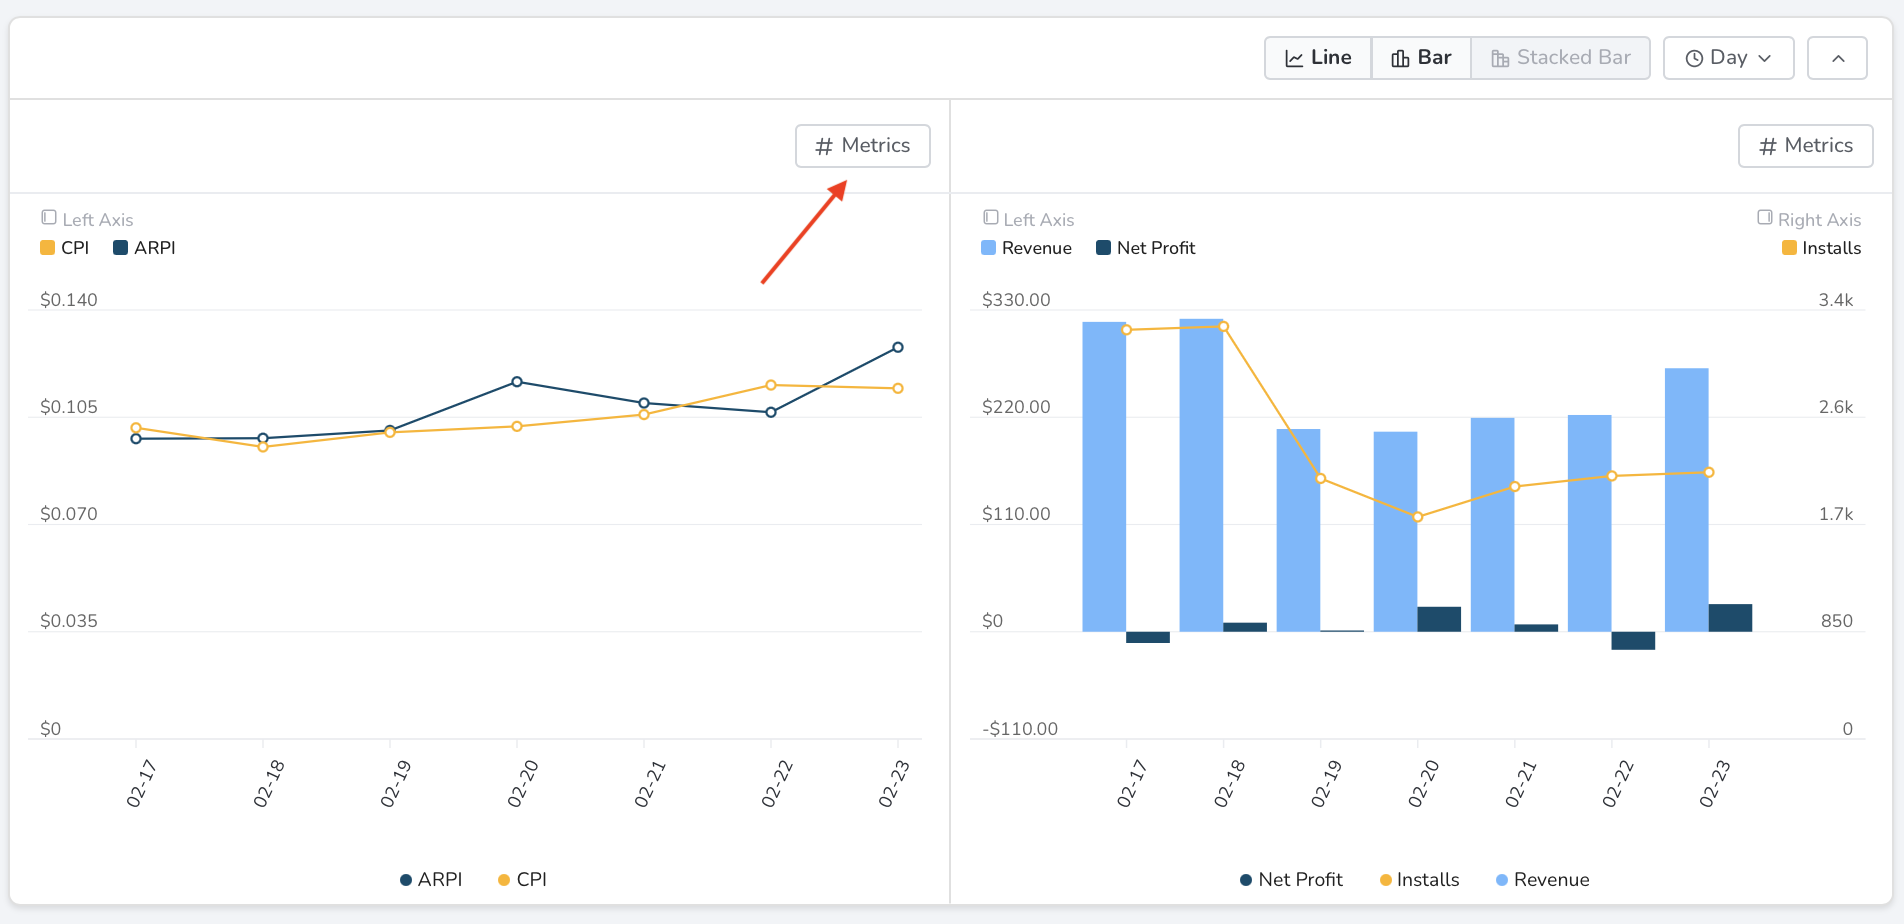
Next to one of your charts, click Metrics:

This opens a view where you can:
- Edit what metrics are shown in the chart
- Configure the chart's axes
The number of total metrics and metrics-per-axis you can choose varies per chart.
Add chart metrics
There are two types of metrics you can add to your chart:
- Predefined metrics: justtrack defines the calculation for these metrics.
- Custom metrics: you define the calculation for these metrics.
Adding either will automatically update the chart with your new metric. When you have reached the limit, you'll need to remove a metric from the chart in order to add a new one.
All metrics you choose for a single axis must be of the same type. For example, you can't display both Active Users, which is a number, and Revenue which is an amount in USD, on the same axis.
This is to maintain consistent axis values and scale for all metrics in the chart.
The metrics available to display in your chart don't necessarily correspond to the metrics present in the table.
Add a predefined metric
To add a predefined metric to the chart:
- In the Metrics sidebar, click Add metric under your preferred axis.
- Search for the metric you want to add.
- Select the metric.
Add a custom metric
This functionality is only available in the Statistics and Events data views.
If you already created a custom metric in the table, you can use it in the chart:
- In the Metrics sidebar, click Add metric under your preferred axis.
- Search for the metric under the CUSTOM section.
- Select the metric.
To add a new custom metric to the chart:
- In the Metrics sidebar, click Add metric under your preferred axis.
- Click Create custom metric.
- Name the custom metric.
- Configure the parameters by which the custom metric is calculated:
- First, choose the predefined metric as the data set to include in your calculation.
- Then, if available, choose how you want the metric data aggregated.
- Then, if available, choose the operand by which the aggregated metric data is divided.
- Finally, if you need to limit the input data that gets calculated into the final metric, click Advanced options > Add more options.
- Click Create Metric.
The justtrack platform doesn't persist changes to chart metrics outside the scope of a session. This includes custom metrics that you create. So, if you open a new tab, browser, or window, you will have to create the custom metric again to use it.
Remove a metric
In the Metrics sidebar, click the X icon next to the metric you want to remove from the chart.