Filter data
Within a data view, you can filter the data shown in the table or charts. You can restrict your data to include or exclude specific values for your dimensions and metrics.
In this guide, you'll learn how to filter your data.
The justtrack platform doesn't persist changes to chart or table configurations outside the scope of a session. So, if you open a new tab, browser, or window, you will see the default configurations.
Before you begin
This guide is relevant for the following data views:
Though, the exact options available to you differ between these views.
Edit data filters
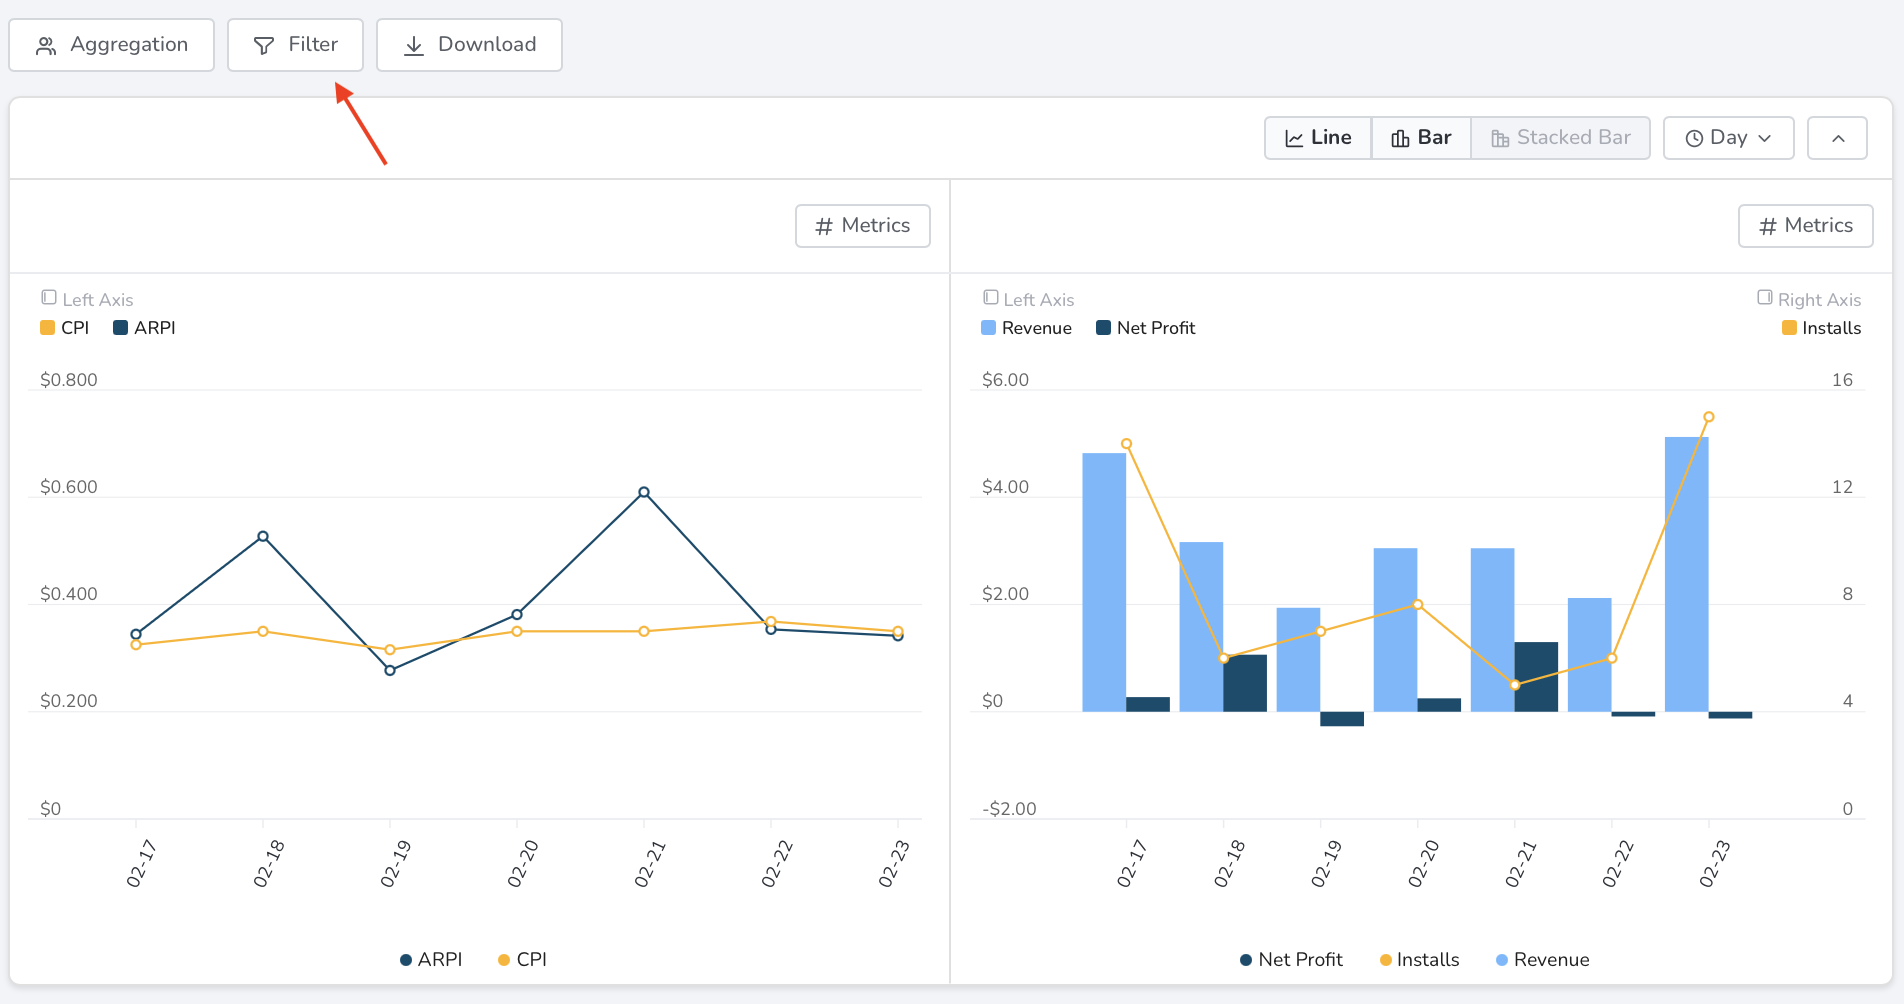
Click Filter:

This opens a sidebar where you can add and remove data filters. There is no limit to the amount of filters you can have for your data.
Add a filter
In the Filter sidebar:
- Click Add filter.
- Search for the dimension or metric you want to filter by.
- Select the dimension or metric.
- Configure the parameters for the filter.
- First, choose whether to Include or Exclude rows that match your filter.
- Then, choose the dimension or metric to filter by.
- Finally, choose the evaluation criteria for the filter.
The dimensions and metrics you filter by don't have to be present in the table or charts. However, you can't filter on custom metrics.
When you add or update the parameters of a filter, the table and charts update automatically. If you leave the evaluation criteria empty, the filter is ignored:
The data in the table is rounded, but metric filters are applied to the real value, not the rounded value. Therefore, it's possible to filter out rows whose values in the table look like they should match.
For example, if the revenue for one of your ad partners is $999.99. This will be displayed in the table as $1000. If you add a filter to Include all rows where the Revenue is greater than or equal to $1000, the row for that partner will be excluded because the real value of the revenue doesn't match the filter criteria.
Remove a filter
In the Filter sidebar, click the X icon next to the filter you want to remove.