View a funnel
A funnel is a data view dedicated to analyzing users' in-app behaviors. It consists of steps that mark key events users trigger as they use your app. There are two types of funnels you can create:
- Standard funnel: Can include any type of event you receive from the justtrack SDK.
- Progression funnel: Includes only
jt_progressionevents, but provides more detailed data about each step in the progression.
In this guide, you'll learn how to view these funnels, and what the differences are between their data views.
Navigate to funnels
In the App Menu, navigate to Funnels. This opens the funnels list where you can see details about your funnels.
From here, click a funnel to open its data view. Depending on the funnel type, the data view will be slightly different.
Standard funnels
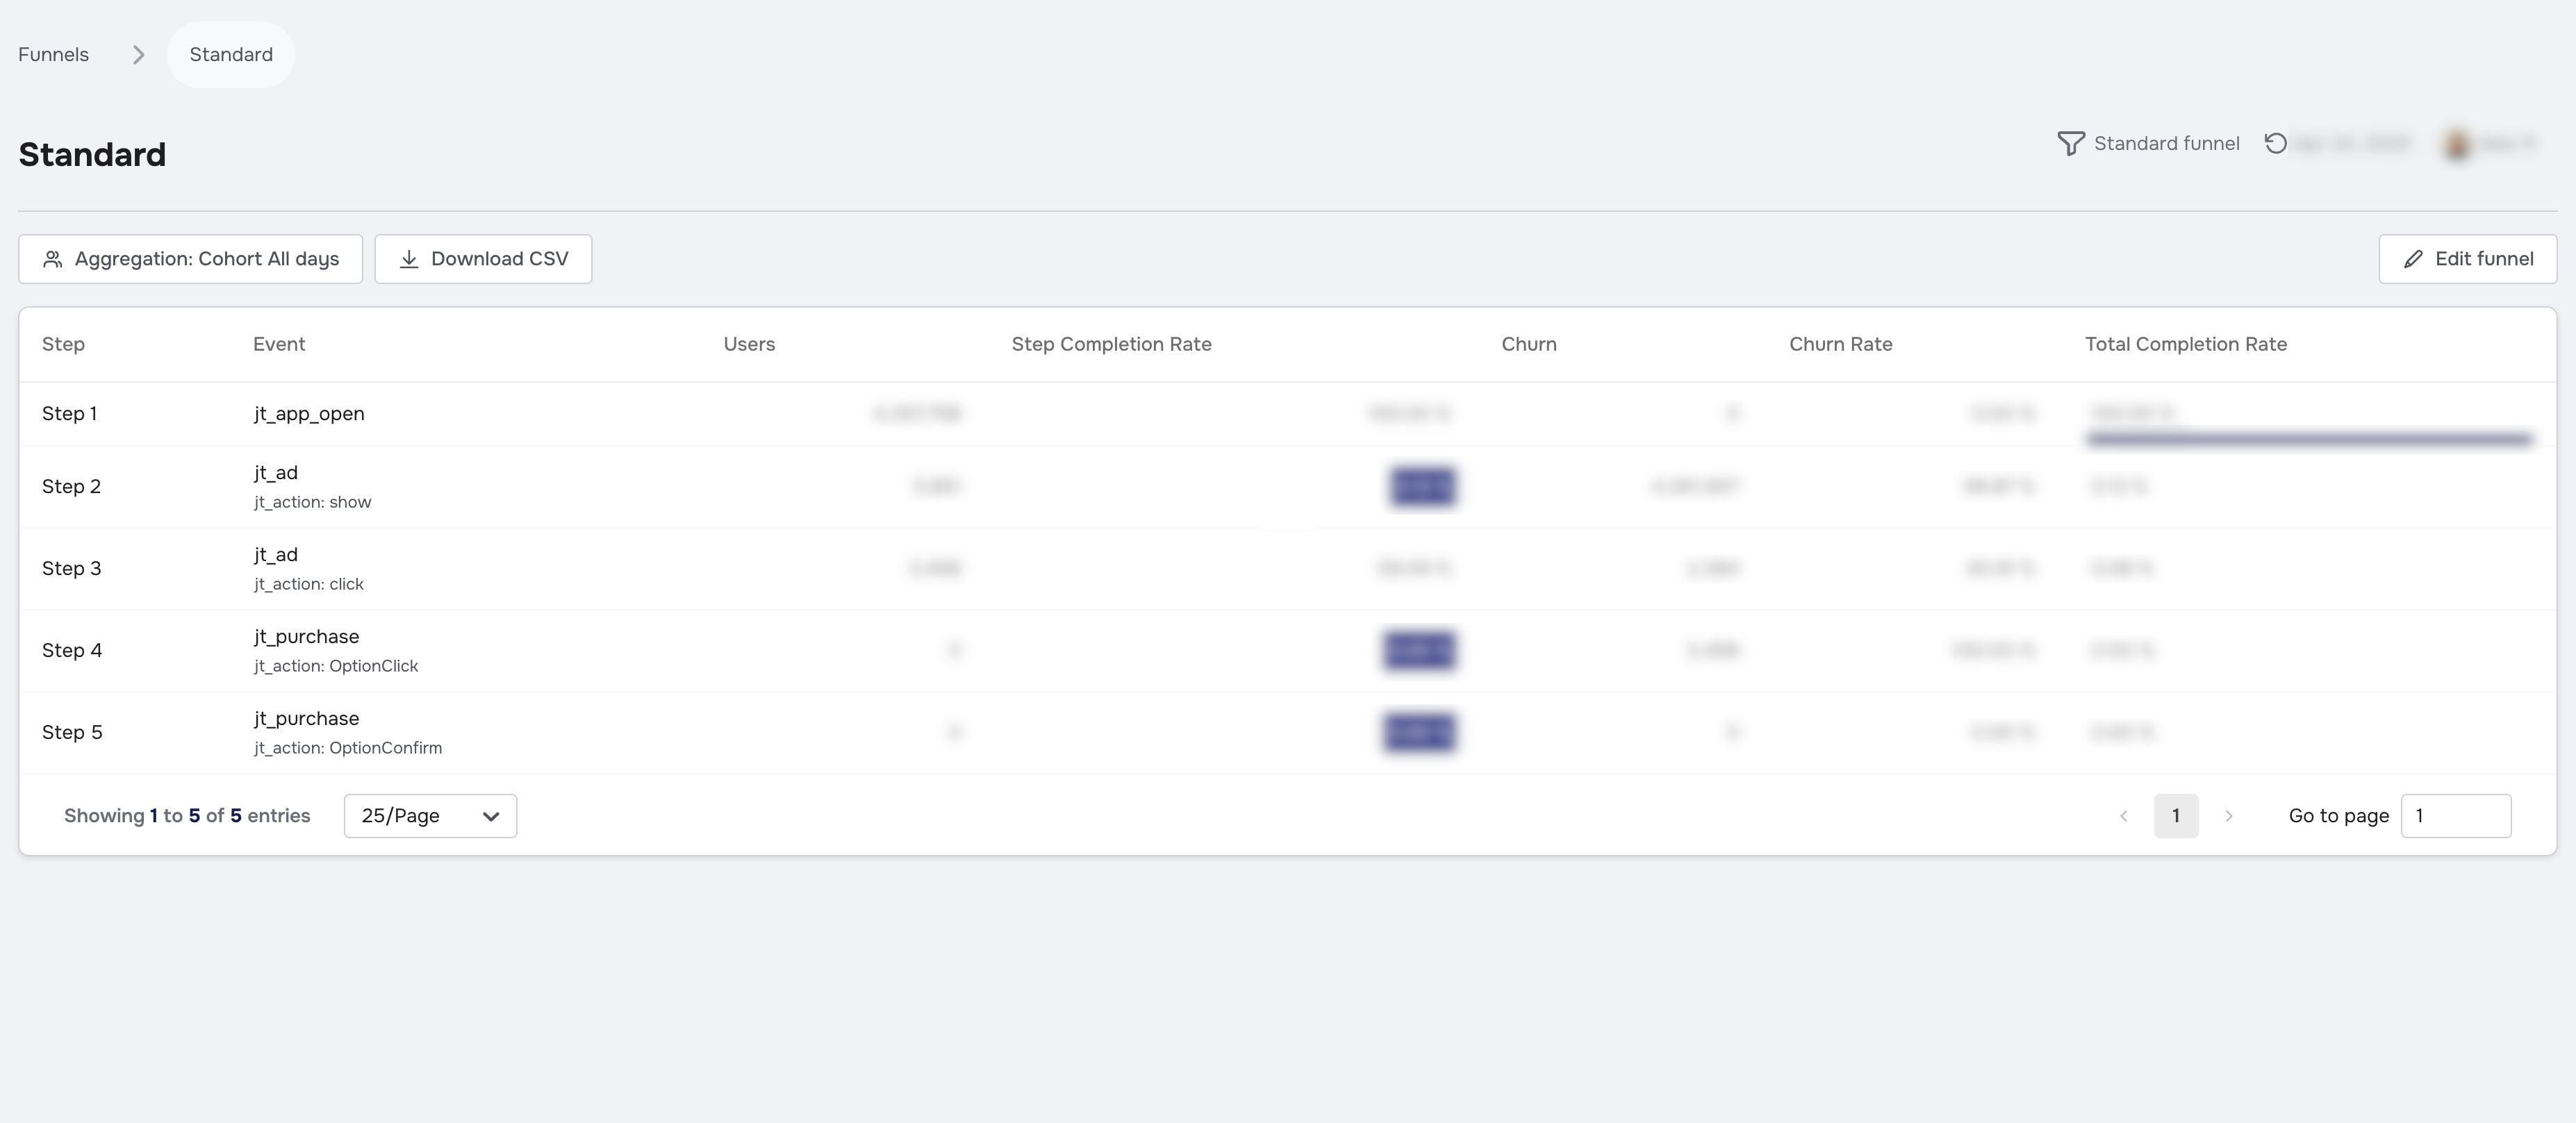
The standard funnel includes the following columns:
| Column | Description |
|---|---|
| Users | The number of users who matched this step and all previous steps. |
| Step Completion Rate | The number of users who matched this step divided by the ones who matched the last step. |
| Churn | The number of users who haven't matched this step, but matched the last step. |
| Churn Rate | The percentage of users who haven't matched this step, but matched the last step. |
| Total Completion Rate | The number of users who matched this step divided by the total users that entered the funnel (matched the first step). |
All numbers only count unique users. Also, for a user to be counted for a step, they must have matched all previous steps. See our documentation on funnel steps for more info.
Progression funnels
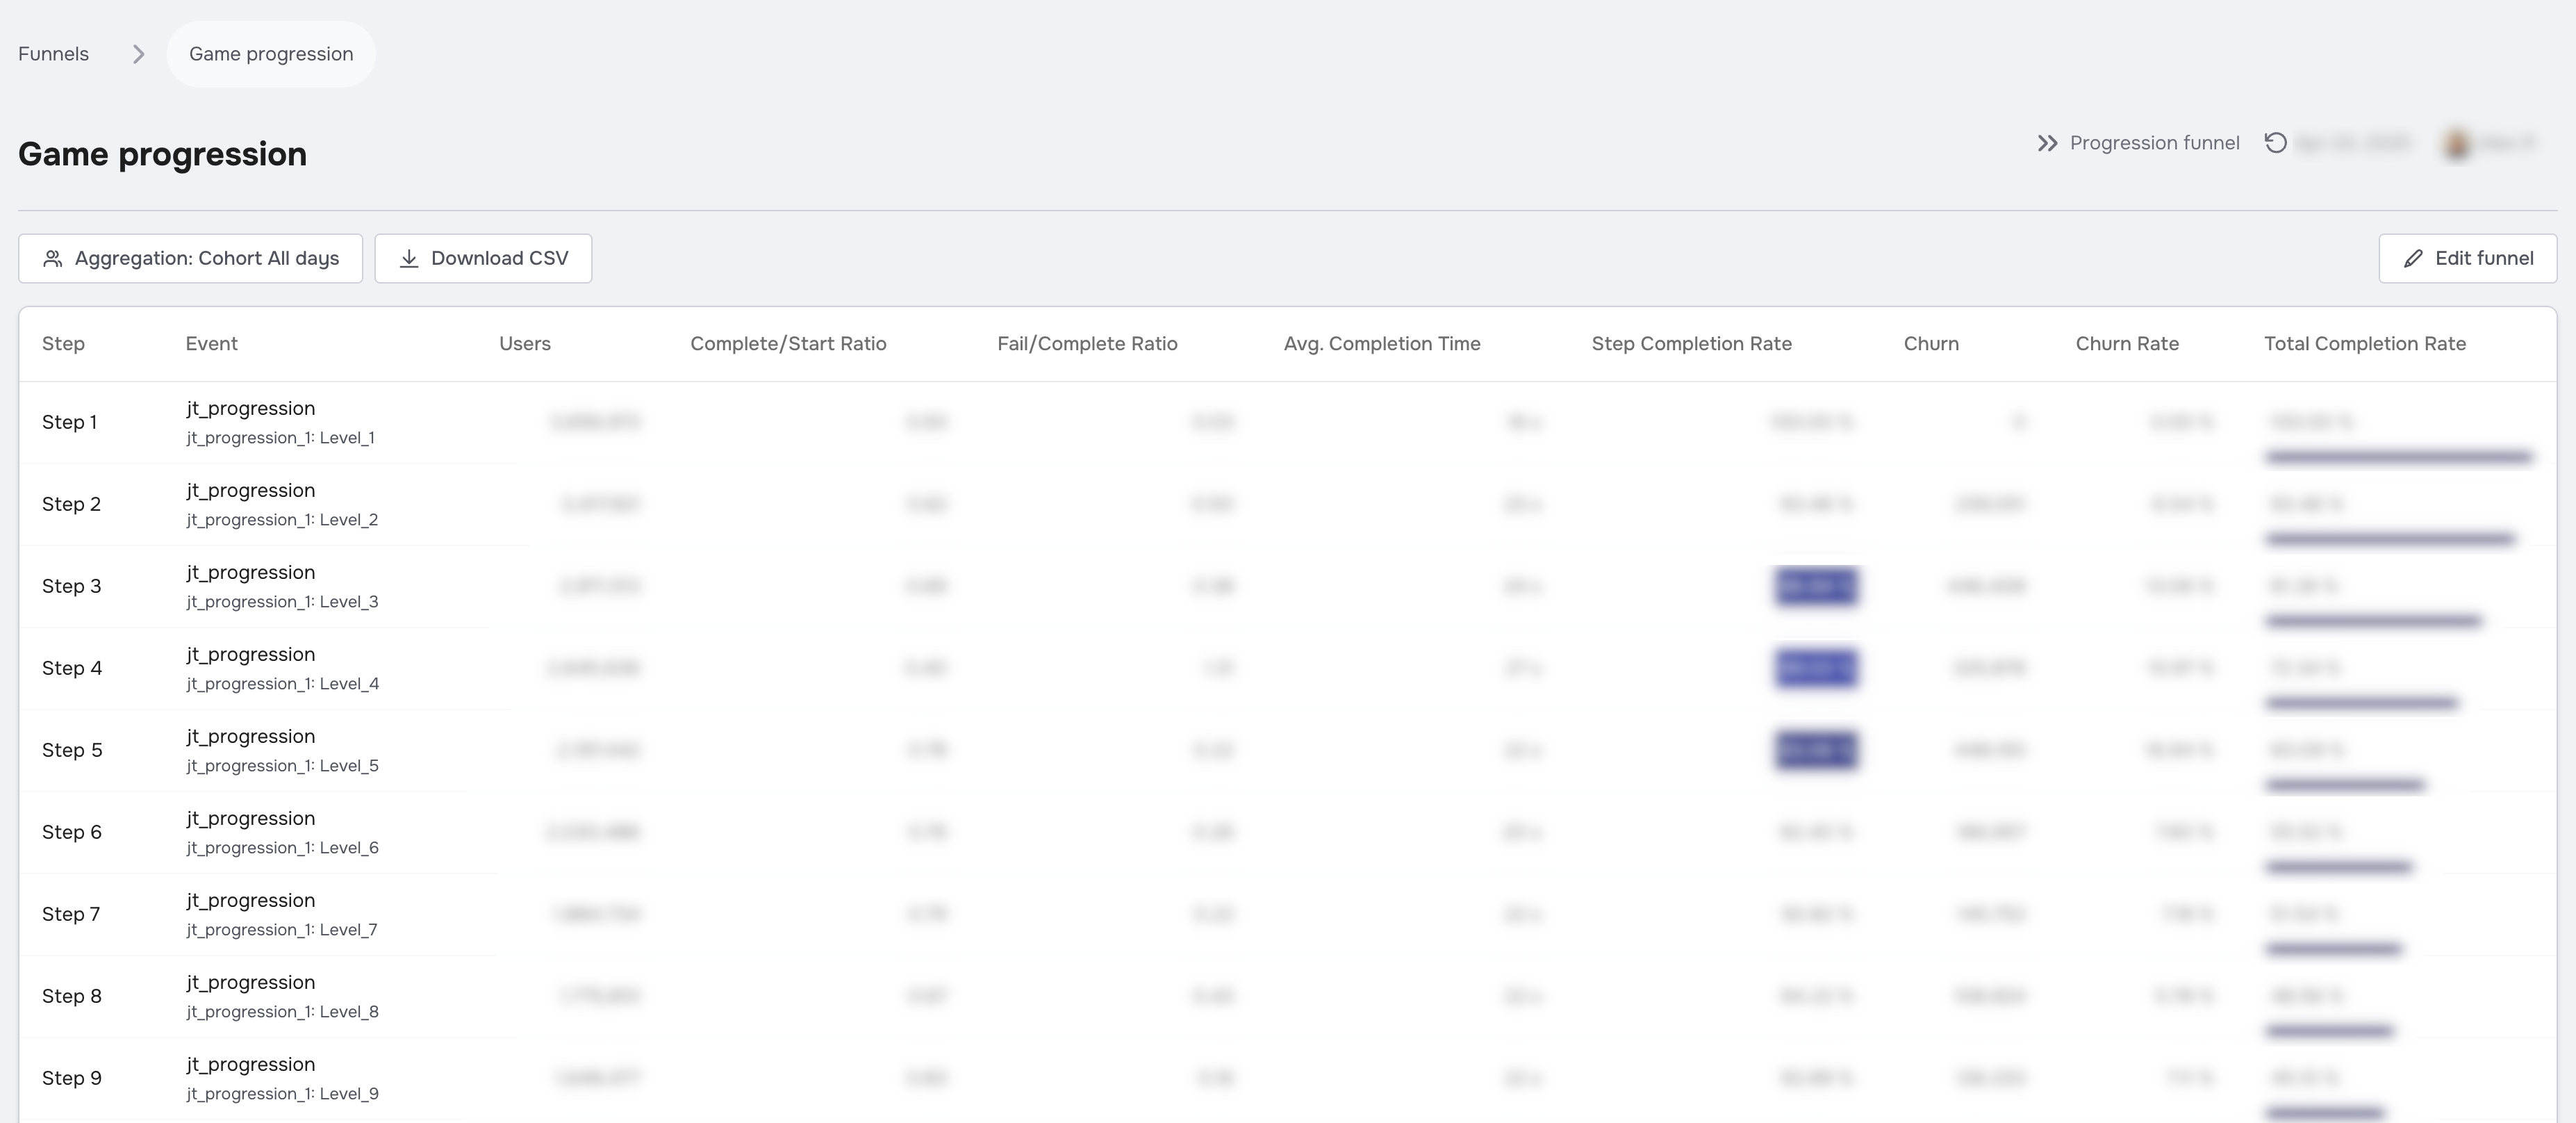
The progression funnel includes the following columns:
| Column | Description |
|---|---|
| Users | The number of users who matched this step. |
| Complete/Start ratio | The number of users who completed this step divided by the ones who started it. |
| Fail/Complete ratio | The number of users who failed this step divided by the ones who completed it. |
| Avg. Completion Time | The average amount of time it takes users to complete this step. You provide the completion time on the jt_progression(jt_action="complete") event. |
| Step Completion Rate | The number of users who matched this step divided by the ones who matched the last step. |
| Churn | The number of users who haven't matched this step, but matched the last step. |
| Churn Rate | The percentage of users who haven't matched this step, but matched the last step. |
| Total Completion Rate | The number of users who matched this step divided by the total users that entered the funnel (matched the first step). |
All numbers only count unique users. Also, for a user to be counted for a step, they must have matched all previous steps. See our documentation on funnel steps for more info.