Data views
In the justtrack platform, there are many views with which you can analyze your data. Some views have user interfaces tailored for specific use cases. The following views, however, present data in a consistent way:
Organization-Level Performance Overview
The Performance Overview page provides a high-level, aggregate view designed for management to track the collective performance of your organization's entire app portfolio.
By separating organization-level data from individual app-level management flows, this dashboard allows stakeholders to quickly assess overall portfolio health and profitability. Unlike the granular app-level Statistics page, the Performance Overview offers a curated, reduced set of metrics and dimensions tailored for executive and portfolio-wide analysis.
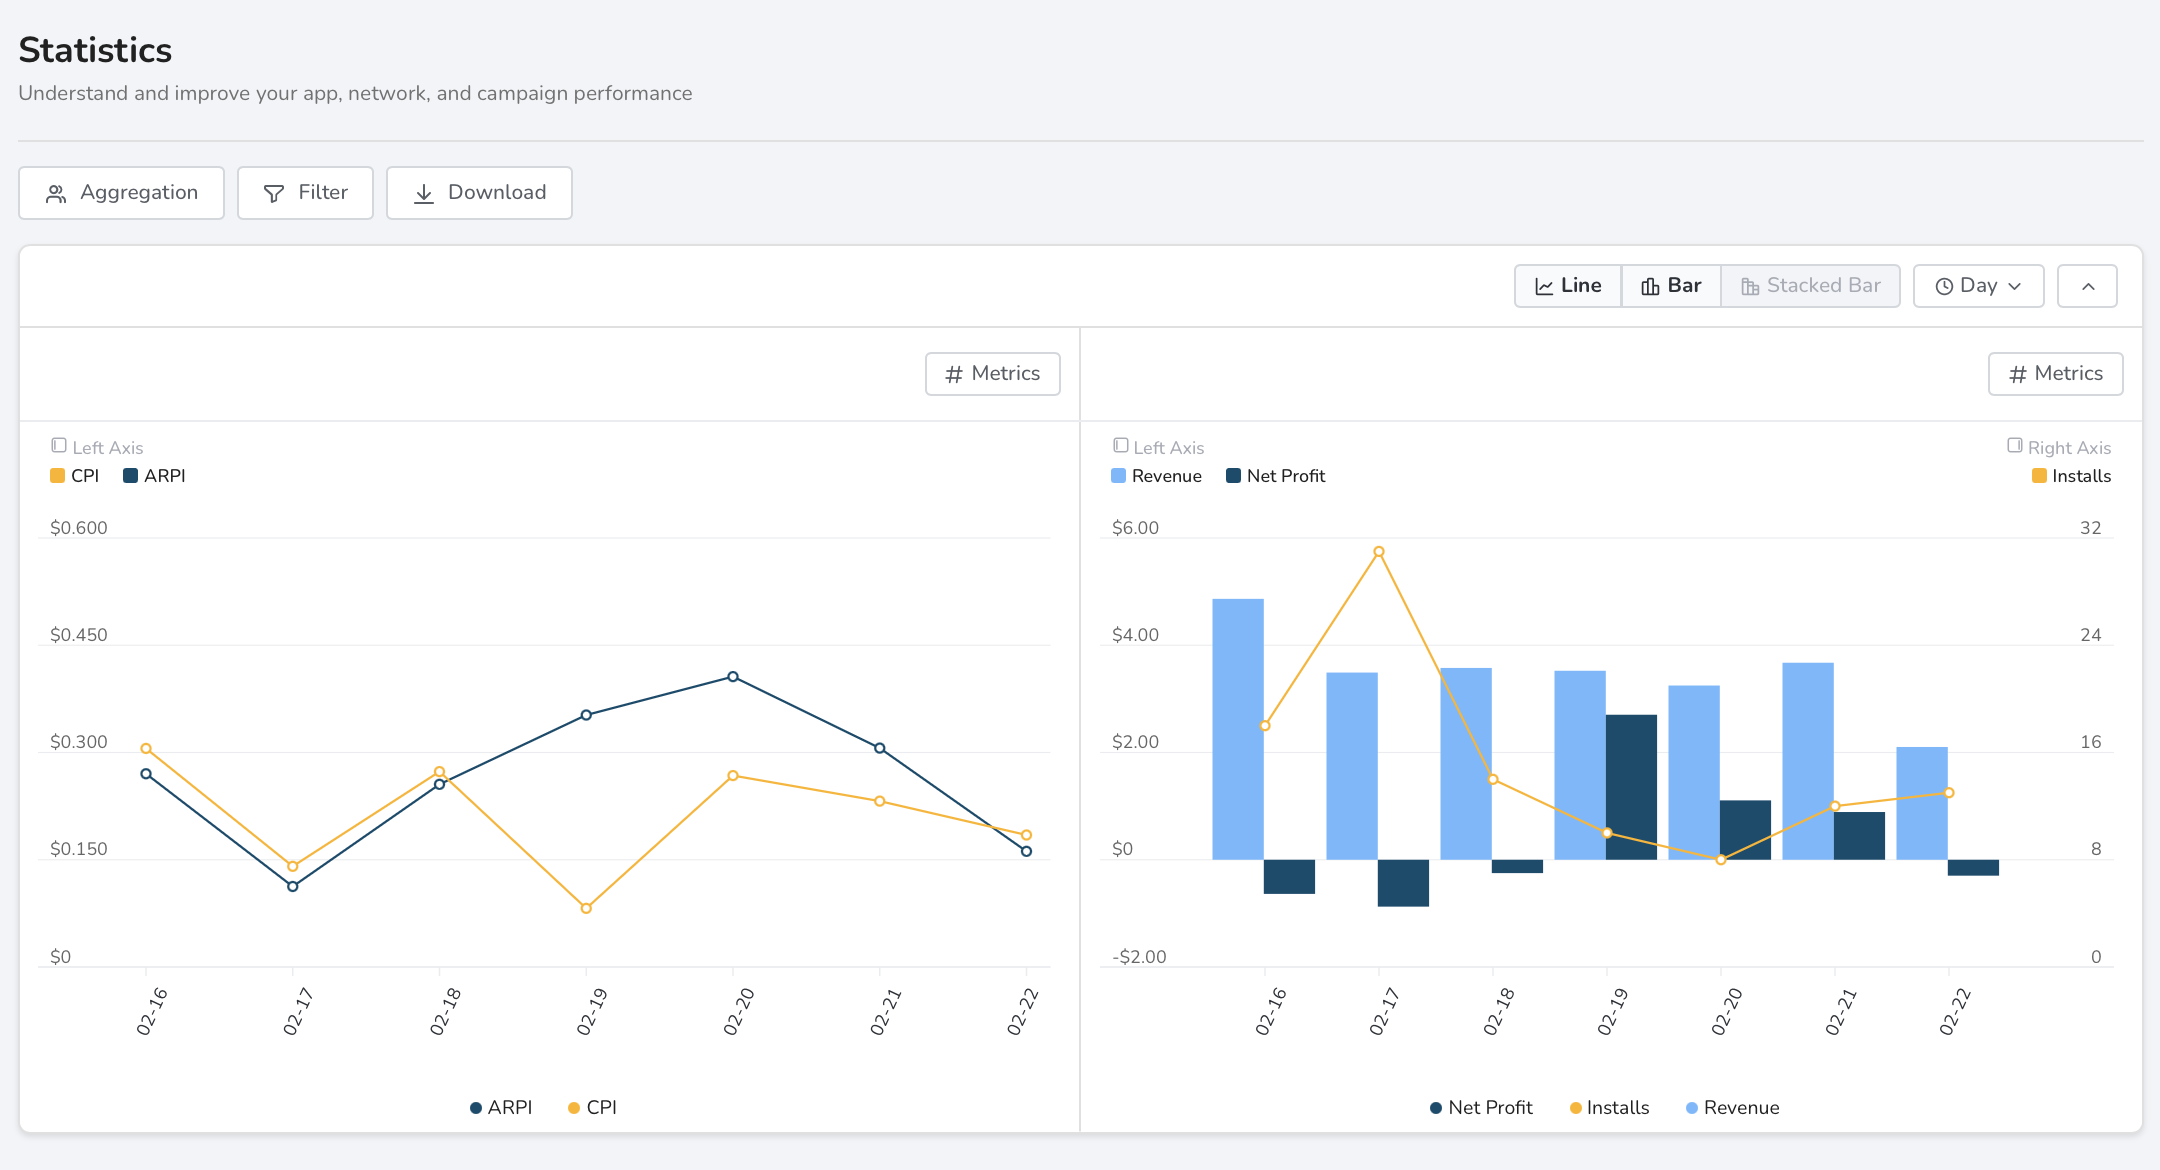
App-Level Statistics
Statistics is the general data analytics page in justtrack. Here, you can configure the tables and charts with marketing, monetization, and app goal metrics. While this page has the broadest set of options, the other, more specialized pages offer more functionality for their target use cases.
App-Level Events
On the Events page, you'll find data about App Events.
The table on this page shows the following metrics:
- Event Count: The number of times we received an instance of the event.
- Unique Users: The number of unique users who triggered the event.
- Event Value Sum: The sum of the values sent for all instances of the event.
- Avg. Event Value: The average value sent for the event.
Only events that come from justtrack SDK version 5.0.0 or later are presented in this view. If you need events from older SDKs, you'll need to use raw data exports.
App-Level Ad Revenue
On the Ad Revenue page, you'll find data about the revenue you receive from ads shown in your app or game.
On this page, you can configure the table to show some of the following metrics:
- Revenue: The amount of revenue you earn.
- Ad Impressions: The number of times an ad is shown on a user's screen within your app.
- Ad RPM: Effective cost per thousand ad impressions
- Ad Monetized Users: Number of users who saw at least one ad impression
- Revenue Count: The number of revenue events.
App-Level In-App Purchases
On the In-App Purchases page, you'll find data about the revenue you receive from in-app purchases shown in your app or game. This page looks and behaves just like Ad Revenue, but with in-app purchase data.