Analyzing Experiment Results
The Experiment Results page provides a comprehensive dashboard to evaluate variant performance and statistical significance.
Experiment Status & Duration
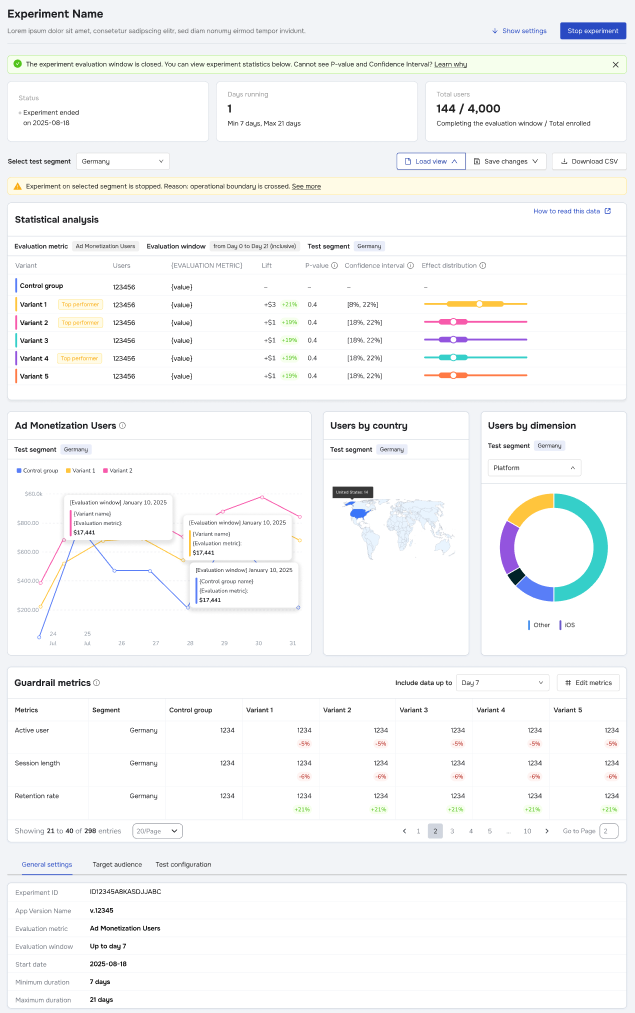
At the top of the page, you will see the experiment's current status, total days running, and user enrollment statistics (Total enrolled vs. Completed evaluation window).
- Status Alerts: Banners may indicate if an experiment was aborted or if operational boundaries were crossed.
- Stop Experiment: For Live experiments, a Stop experiment button is available in the top right.
- User Un-assignment: When an experiment reaches its Maximum duration, it automatically ends.
- Extended Assignment: Even after the experiment ends, users remain assigned to their specific variant for an additional period equal to the Evaluation Window. This ensures data is captured for users who enrolled near the very end of the test.
Statistical Analysis Table
This is the core of your report, comparing Variants against the Control group:
- Lift: Shows the percentage increase or decrease in the metric compared to the control.
- Green: Positive lift.
- Red: Negative lift.
- P-value: Indicates statistical significance. Lower values suggest the result is less likely to be due to chance.
- Confidence Interval: The range in which the true value is likely to fall.
- Top Performer: A visual badge indicating the winning variant.
Note: P-value and Confidence Interval data may not appear until a minimum sample size threshold is reached. Revenue Data Delay: If using Revenue or Ad Revenue metrics, allow up to 72 hours for data to fully settle due to third-party import delays and corrections.
Visualizing Data
- Metric Graph: View the performance trend over time. Hover over data points to see specific values for each variant.
- Users by country: A map visualization of your traffic distribution.
- Users by dimension: A donut chart breaking down users by platform or other dimensions.
Segmentation & Filtering
If you configured Test Segments during setup, use the dropdown menu at the top (e.g., "Select test segment") to filter the entire dashboard. This allows you to see if a variant performed differently for specific groups, such as "Germany" vs. "Spain."
Guardrail Metrics
Located at the bottom of the page, this section allows you to